.svg)


.svg)
- Global office utilization hit 53% in 2026; nearly half of organizations target 76-85%
- Five metrics matter most: utilization, occupancy, satisfaction, collaboration frequency, cost per desk
- Utilization below 40% or eNPS below 5 are red flags that demand immediate action
- Benchmarking monthly on space data and quarterly on engagement separates leaders from laggards
- Internal benchmarks beat industry averages; track your own trajectory first
Most workplace leaders we talk to have a gut sense of whether their office is working. Fewer can put a number on it. Workplace experience benchmarks give you that number, and more importantly, they tell you whether the number is good, bad, or just average. This guide compiles the most current data available so you can compare your metrics against peers, spot problems before they become expensive, and prioritize the fixes that actually move the needle.
What are workplace experience benchmarks?
A workplace experience benchmark is a reference point. It's a number that tells you how your office performs relative to your own history, your industry, or the broader market. Without one, you're guessing.
The reason benchmarking matters more in 2026 than it did in 2019 is simple: hybrid work made everything variable. When everyone showed up five days a week, you could eyeball whether the office was full. Now, with attendance shifting by day, team, and season, you need data to understand what's actually happening. 83% of CRE teams now track utilization as their top metric, up significantly from pre-pandemic levels. The ones who don't are flying blind.
Benchmarks serve three purposes. First, they help you justify investment. Telling your CFO "the office feels underused" gets you nothing; showing that your utilization is 15 points below the industry median gets you a conversation. Second, they surface problems early. A slow decline in occupancy over three months is invisible without a baseline. Third, they help you set realistic targets. Aiming for 95% utilization in a hybrid environment isn't ambitious; it's delusional.
The challenge is knowing which metrics to track, how to collect the data, and what "good" actually looks like. That's what the rest of this guide covers.
Five metrics every workplace leader should measure
Not every number matters equally. These five give you the most complete picture of whether your workplace is performing, and they're the ones that show up most consistently in industry research.
1. Space utilization rate
This is the percentage of your available space that's actively used over a given period. It's the single most important metric for understanding whether you're getting value from your real estate. Global office utilization reached 53% in 2026, up from 38% in 2024. That's progress, but it still means nearly half of office space sits empty on an average day.
Utilization isn't just about desks. It includes meeting rooms, collaboration zones, phone booths, and common areas. A deep dive into space utilization metrics can help you understand the nuances of measuring each space type.
2. Office occupancy rate
Occupancy is a snapshot: how many people are physically present right now, compared to your building's capacity. Utilization looks at space over time; occupancy looks at people at a point in time. You need both.
The distinction matters because you can have high utilization (desks booked all day) but low occupancy (people booked but didn't show up). Ghost bookings are a real problem, and occupancy data is how you catch them. For a deeper breakdown of the math, our guide on office occupancy rate walks through the formulas.
3. Employee satisfaction and engagement
Space metrics tell you what's happening. Satisfaction metrics tell you whether people care. The two most common measures are employee Net Promoter Score (eNPS) and engagement index scores.
Engagement index scores averaged 6.9 in early 2025, down from 7.1 the prior quarter, a trend that continued into 2026. That decline matters because engagement correlates directly with retention and productivity. If your people don't want to be in the office, no amount of space optimization will fix the problem.
4. Collaboration frequency
This is the metric most teams forget to track, and it's arguably the one that justifies the office's existence. 68% of employees cite collaboration as their primary reason for coming in. If your office isn't facilitating meaningful collaboration, you're paying for an expensive commute.
Collaboration frequency can be measured through meeting room bookings, team co-location data (how often team members are in the office on the same day), and event attendance. It's less precise than utilization, but it tells you whether the office is doing its job.
5. Cost per employee and cost per desk
This is where the CFO's ears perk up. Cost per desk includes rent, utilities, maintenance, technology, and amenities divided by the number of available desks. Cost per employee divides total workplace spend by headcount.
These numbers vary wildly by market. A desk in Manhattan costs three to four times what it costs in Austin. But the ratio between cost per desk and utilization is universal: if you're paying for desks nobody uses, you're wasting money. Our cost per desk guide breaks down the calculation and shows where the biggest savings opportunities hide.
How to collect workplace experience data
Good benchmarks require good data. The problem most organizations face isn't a lack of data sources; it's that the data lives in six different systems that don't talk to each other.
Badge and access control data
Your badge system already knows who enters the building and when. It's the most reliable source of occupancy data because it captures actual presence, not intent. The limitation is that it only tells you someone entered; it doesn't tell you where they sat or what they did. If you're evaluating badge access systems, look for ones that integrate with your workplace management platform.
Desk and room booking systems
Booking data captures intent: who planned to use a space and when. Comparing booking data against badge data reveals your no-show rate, which is one of the most actionable metrics you can track. If 30% of booked desks go unused, you don't have a space problem; you have a behavior problem.
Sensors and occupancy tracking
Sensors provide the most granular data: real-time headcounts by zone, heat maps of movement, and duration of stay. They're also the most privacy-sensitive data source. If you're considering sensors, our guide on workplace sensors and privacy covers the compliance considerations you'll need to address.
Employee surveys
Surveys capture what no sensor can: how people feel. A quarterly pulse survey with 10 to 15 questions on workspace satisfaction, collaboration quality, and commute burden gives you the qualitative layer that space data misses. The key is consistency. Ask the same questions every quarter so you can track trends.
Unified analytics platforms
The real power comes from combining all four data sources into a single view. When you can see that Tuesday has 70% occupancy but only 45% meeting room utilization, you know people are coming in but not collaborating. That's a design problem, not an attendance problem. Gable's Insights dashboard pulls booking, access, and utilization data into one place, making it possible to benchmark across locations and time periods without stitching spreadsheets together. For a broader look at how workplace analytics drives decisions, that guide covers the full landscape.

Benchmarks only matter if you're tracking the right outcomes. This guide covers the metrics that separate thriving hybrid programs from struggling ones.
Read the guide
2026 Benchmark ranges by industry and company size
Here's where the numbers get specific. I've pulled from the most current industry reports to give you ranges, not single targets, because your context matters more than a universal average.
Space utilization benchmarks
87% of organizations now set explicit targets, with nearly half aiming for 76-85% utilization. That's ambitious. Most organizations aren't there yet, but the gap between current performance and target is where the opportunity lives.
Peak utilization (your busiest day of the week, usually Tuesday or Wednesday) should hit around 80%. If your peak day is below 65%, your office isn't pulling people in even on the days they're most likely to come.
For financial services firms navigating these numbers, our guide on financial services hybrid workplaces covers sector-specific considerations.
Occupancy benchmarks
Larger companies consistently show lower occupancy because they have more distributed teams, more remote-eligible roles, and more complex scheduling. That's not a failure; it's a structural reality. The question is whether your space portfolio reflects it.
Employee engagement benchmarks
The mid-market dip in eNPS (companies with 1,000 to 5,000 employees scoring just 4.0) is striking. These organizations are often big enough to feel impersonal but not big enough to have dedicated employee experience teams. If you're in that range, engagement deserves extra attention.
Meeting room efficiency
Typical meeting room utilization falls between 60% and 75% of booked hours versus available hours. 61% of companies report utilization between 41% and 80%. Below 50% suggests you have too many rooms, rooms that are the wrong size, or a ghost booking problem. Our guide on AI room scheduling covers how automated systems reduce no-shows and right-size room allocation.
Cost per desk
These ranges include rent, utilities, maintenance, and basic technology. When your cost per desk exceeds the top of the range for your market and your utilization is below 50%, you're paying premium prices for space that sits empty most of the week.
Red-flag thresholds: When your metrics demand action
Benchmarks are useful for context. Red flags are useful for urgency. Here are the thresholds that should trigger immediate investigation.
Utilization below 40%
You're overspaced. At 40% utilization, six out of every ten desks are empty on an average day. This isn't a hybrid work pattern; it's a portfolio problem. Start by auditing which floors and zones are consistently underused, then explore consolidation. Our office consolidation strategy guide walks through the process.
Occupancy at 25% or below on most days
If only a quarter of your capacity shows up on a typical day, something is broken. Either your hybrid policy isn't clear, your RTO expectations aren't being met, or people are actively avoiding the office. Badge data will tell you which; surveys will tell you why.
Meeting room no-show rate above 40%
This is one of the most common and most fixable problems. When four out of ten booked meetings don't happen, you're creating artificial scarcity. People can't find rooms because they're "booked," but the rooms are actually empty. Automated release policies (rooms freed after 10 minutes of no check-in) solve this quickly.
eNPS Below 5
An eNPS of 5 means your promoters barely outnumber your detractors. In a company of 1,000, that's roughly equal numbers of people who'd recommend working there and people who actively wouldn't. This is an engagement emergency, not a facilities problem, but the workplace experience contributes to it.
Cost per desk more than 30% above market median with utilization below 50%
This is the combination that gets workplace leaders called into the CFO's office. You're paying above-market rates for space that's half empty. The fix is usually a combination of lease renegotiation, space consolidation, and shifting some capacity to flexible workspace.
Collaboration frequency declining month over month
If team co-location rates are dropping, the office is losing its primary purpose. This could signal a space design issue (not enough collaboration zones), a cultural issue (teams don't see value in being together), or a scheduling issue (teammates come in on different days).
Gable Insights gives you real-time benchmarks across utilization, occupancy, and cost, so you can spot red flags before they become budget problems.
Learn more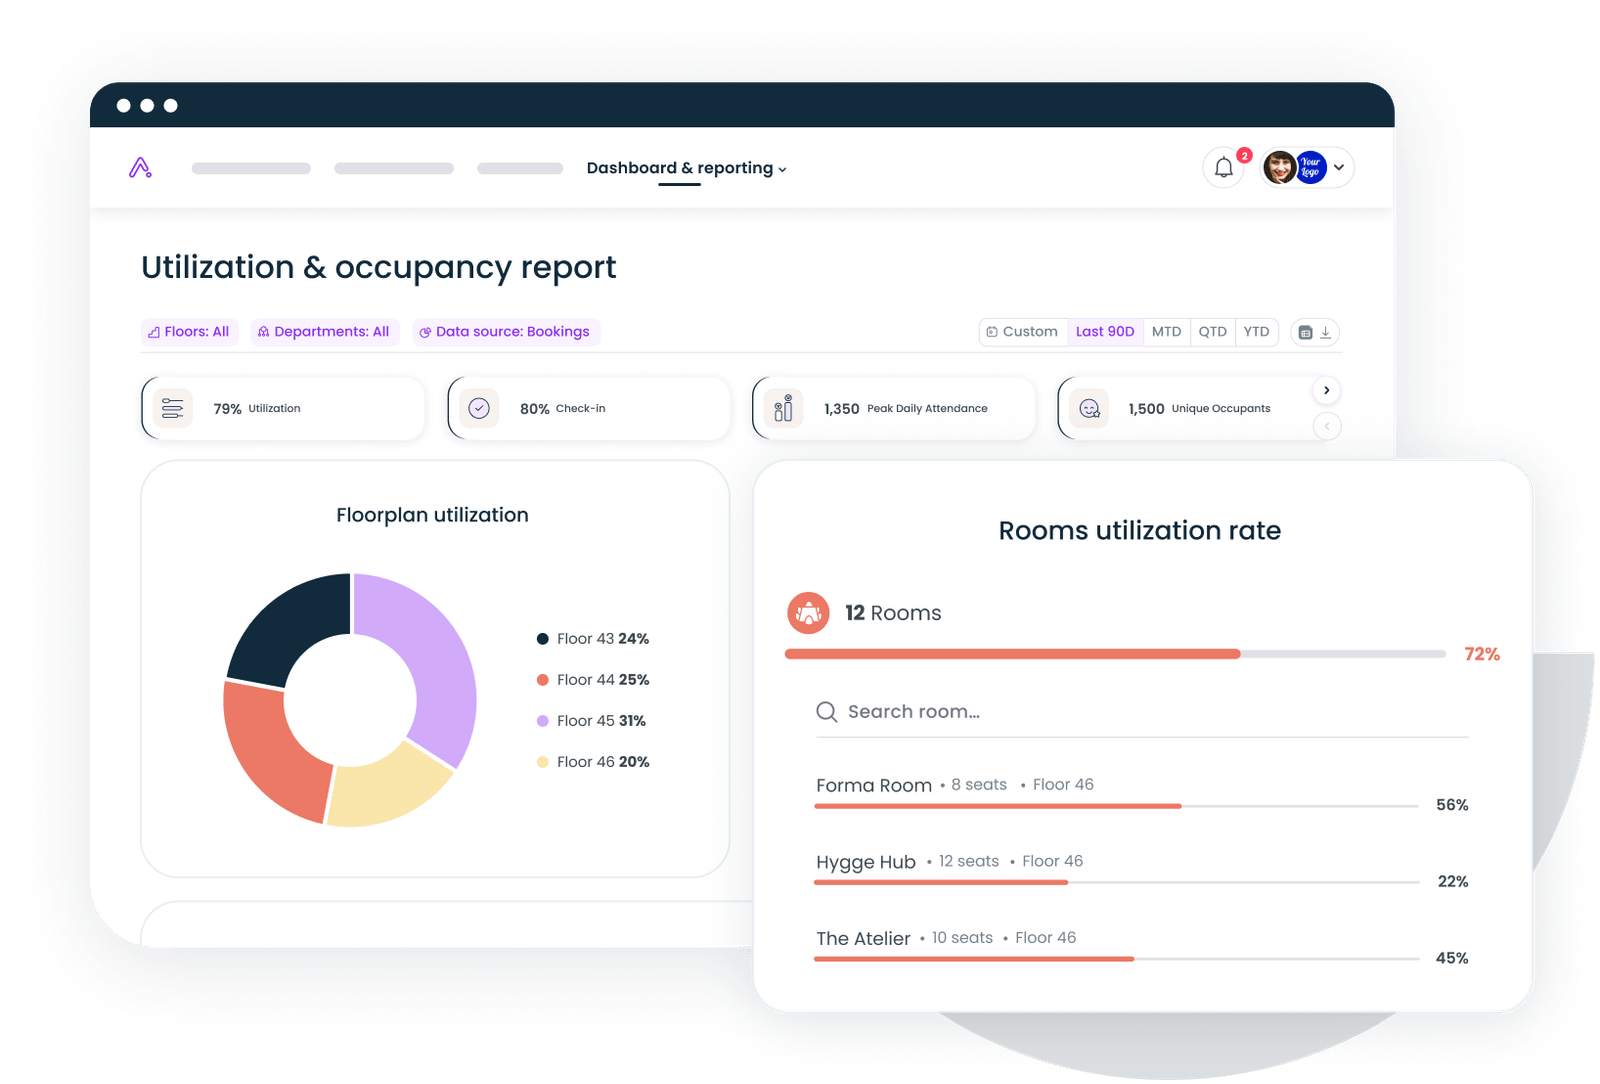
Improvement priorities: Fix your weakest metric first
Not every metric deserves equal attention. The right priority depends on which metric is furthest from its benchmark and which fix delivers the fastest return.
If utilization is your weakest metric
Start with the data. Break utilization down by floor, zone, and day of week. You'll almost always find that the problem is concentrated: two floors are ghost towns while one is overcrowded. The quick win is consolidating active teams onto fewer floors and subleasing or decommissioning the rest.
Medium-term, consider activity-based working: instead of assigned desks, design zones for different work modes (focus, collaboration, social). This naturally increases utilization because space flexes with demand rather than sitting idle when its "owner" works from home.
If occupancy is your weakest metric
Low occupancy is usually a policy or culture problem, not a space problem. Ask three questions: Is your hybrid policy clear about expected in-office days? Do managers model the behavior? Is there a reason to come in beyond "because we said so"?
The companies with the strongest occupancy numbers create genuine pull: team days with structured collaboration, on-site events, and amenities that make the commute worthwhile. Mandates work in the short term but tend to erode engagement.
If satisfaction is your weakest metric
Don't assume the office is the problem. Low satisfaction often reflects broader organizational issues: unclear career paths, poor management, or burnout. But the workplace does contribute. The most common complaints are noise, lack of privacy, poor temperature control, and inadequate technology.
Run a targeted survey that separates workplace-specific satisfaction from overall job satisfaction. If the workplace scores are significantly lower, you have a design or amenity problem. If they're roughly equal, the issue is bigger than the office.
If collaboration is your weakest metric
This is a scheduling and design problem. If teammates aren't in the office on the same days, no amount of collaboration space will help. Start by implementing team anchor days: specific days when each team is expected to be on-site together.
Then look at your space. If 80% of your floor plan is individual desks and 20% is collaboration space, you've designed for heads-down work in an era when people come to the office specifically to work together. Flip the ratio, or at least move it toward 50/50.
If cost is your weakest metric
Cost optimization has three levers: reduce space (consolidation, subleasing), reduce per-square-foot cost (lease renegotiation, relocation), or increase the value you extract from existing space (higher utilization). The first two take months. The third can start tomorrow.
Look at your sharing ratio. If you have one desk per employee but average occupancy is 50%, you could move to a 1.5:1 or even 2:1 sharing ratio without anyone noticing a difference. That's a 33% to 50% reduction in desk count, which translates directly to square footage savings. For a broader view of workplace spend benchmarks, that guide covers what companies your size actually pay.
How to build a benchmarking cadence that sticks
Collecting data once is a project. Collecting it consistently is a program. Here's what a sustainable benchmarking cadence looks like.
Weekly: space metrics
Pull utilization and occupancy data every week. You're looking for patterns (Tuesday is always the busiest day) and anomalies (occupancy dropped 20% this week for no obvious reason). Weekly data is too noisy for strategic decisions but essential for operational awareness.
Monthly: trend analysis
Once a month, compare your metrics against the prior month and against your targets. This is where you catch slow declines that aren't visible week to week. A 2% monthly drop in utilization doesn't feel urgent, but over six months that's a 12-point slide.
Quarterly: engagement and satisfaction
Run your employee survey quarterly. More frequent than that creates survey fatigue; less frequent means you're reacting to stale data. Compare results against your internal baseline first, then against industry benchmarks.
Annually: strategic review
Once a year, step back and compare your full metric set against industry benchmarks, your portfolio strategy, and your business plan. This is when you make big decisions: lease renewals, consolidations, expansions, or shifts to flexible workspace.
The internal vs. external benchmark debate
Industry benchmarks are useful for context, but your most important comparison is against yourself. A company that moves from 35% to 50% utilization has made more meaningful progress than one that's been sitting at 55% for three years. Track your trajectory, not just your position.
That said, external benchmarks prevent complacency. If your utilization is 45% and you think that's fine because it's up from 30%, knowing that the industry median is 53% gives you a more honest picture.
The limits of benchmarking (and what to do about them)
Benchmarks aren't gospel. They're reference points with real limitations.
First, industry averages mask enormous variation. A "53% global utilization" number includes companies at 30% and companies at 80%. Your specific context (industry, geography, hybrid policy, culture) matters more than the average.
Second, benchmarks measure what's measurable, not necessarily what matters. Utilization is easy to track. Whether the collaboration that happens in your office actually produces better work is much harder to quantify. Don't let the measurable crowd out the meaningful.
Third, benchmarks can create perverse incentives. If you optimize purely for utilization, you might pack people into smaller spaces and hurt satisfaction. If you optimize purely for satisfaction, you might give everyone a private office and blow your budget. The goal is balance across all five metrics, not perfection in any single one.
The best workplace leaders I know use benchmarks as conversation starters, not conversation enders. "Our utilization is 12 points below the median" is the beginning of an investigation, not a verdict.
Where workplace experience benchmarks are heading
The benchmarking landscape is shifting in three ways worth watching.
First, real-time benchmarking is replacing periodic reporting. Instead of pulling a quarterly report, leading organizations are monitoring metrics continuously and setting automated alerts when thresholds are crossed. This turns benchmarking from a retrospective exercise into a proactive one.
Second, the metrics themselves are evolving. Collaboration quality (not just frequency), commute burden, and environmental impact are joining the traditional space and cost metrics. As ESG reporting requirements expand, carbon per employee will become a standard workplace benchmark.
Third, AI is making benchmarking more predictive. Instead of just telling you where you are, advanced analytics can forecast where you'll be in three months based on current trends. That's the difference between reacting to a problem and preventing one.
Make your benchmarks work harder than your spreadsheets
Workplace experience benchmarks aren't about chasing someone else's numbers. They're about understanding your own performance clearly enough to make better decisions. The five metrics covered here (utilization, occupancy, satisfaction, collaboration, and cost) give you a complete picture. The benchmark ranges give you context. The red-flag thresholds tell you when to act.
The organizations that get the most value from benchmarking are the ones that build it into their operating rhythm: weekly data pulls, monthly trend reviews, quarterly engagement checks, and annual strategic resets. They compare against themselves first and the market second. And they treat every metric as a question to investigate, not an answer to accept.
Your office is either earning its keep or it isn't. The benchmarks will tell you which.
Gable brings your utilization, occupancy, and cost data into a single dashboard so you can benchmark in real time and act on what you find.
Get a demo