.svg)


.svg)
- Cost per desk divides total workspace spend by available seats
- Most companies pay $8,000-$15,000 per desk annually in major metros
- Hybrid work drops utilization to 40%, making traditional leases expensive
- Track occupancy data to right-size space and cut wasted spend
- Flex spaces cost 20-30% more per desk but eliminate long-term risk
Your CFO wants to know what you're spending per employee on office space. You pull together lease costs, add furniture and IT, divide by headcount, and land on a number that feels high but not absurd.
Then someone asks: how many of those desks are actually being used?
That's when the math gets uncomfortable. 40% of office desks sit on any given day in hybrid companies. You're paying for 100 desks when 60 would cover peak demand. Cost per desk as a static formula doesn't tell you much if half your desks collect dust.
This guide walks through how to calculate cost per desk, what numbers to expect, and how to use occupancy data to stop paying for space your team doesn't need.
What is cost per desk?
Cost per desk is your total annual workspace expense divided by the number of desks you provide. It's the unit economics of office space.
The formula: Total workspace costs ÷ Number of desks = Cost per desk
Workspace costs include:
- Lease or rent
- Utilities (power, water, HVAC)
- Furniture and equipment
- IT infrastructure (wifi, monitors, docking stations)
- Maintenance and janitorial services
- Property taxes and insurance
Number of desks means usable workstations. Conference rooms, phone booths, and collaboration zones don't count unless they function as individual work spaces.
Cost per desk gives you a baseline. It doesn't factor in utilization, which is why companies with 40% occupancy rates still report cost per desk in the $10,000-$15,000 range. The seat exists. You're paying for it. Whether anyone sits there is a separate question.

Calculate cost per desk and compare it to occupancy data. Gable's analytics show you which seats are used, which sit empty, and where you can cut costs without losing capacity.
Get utilization data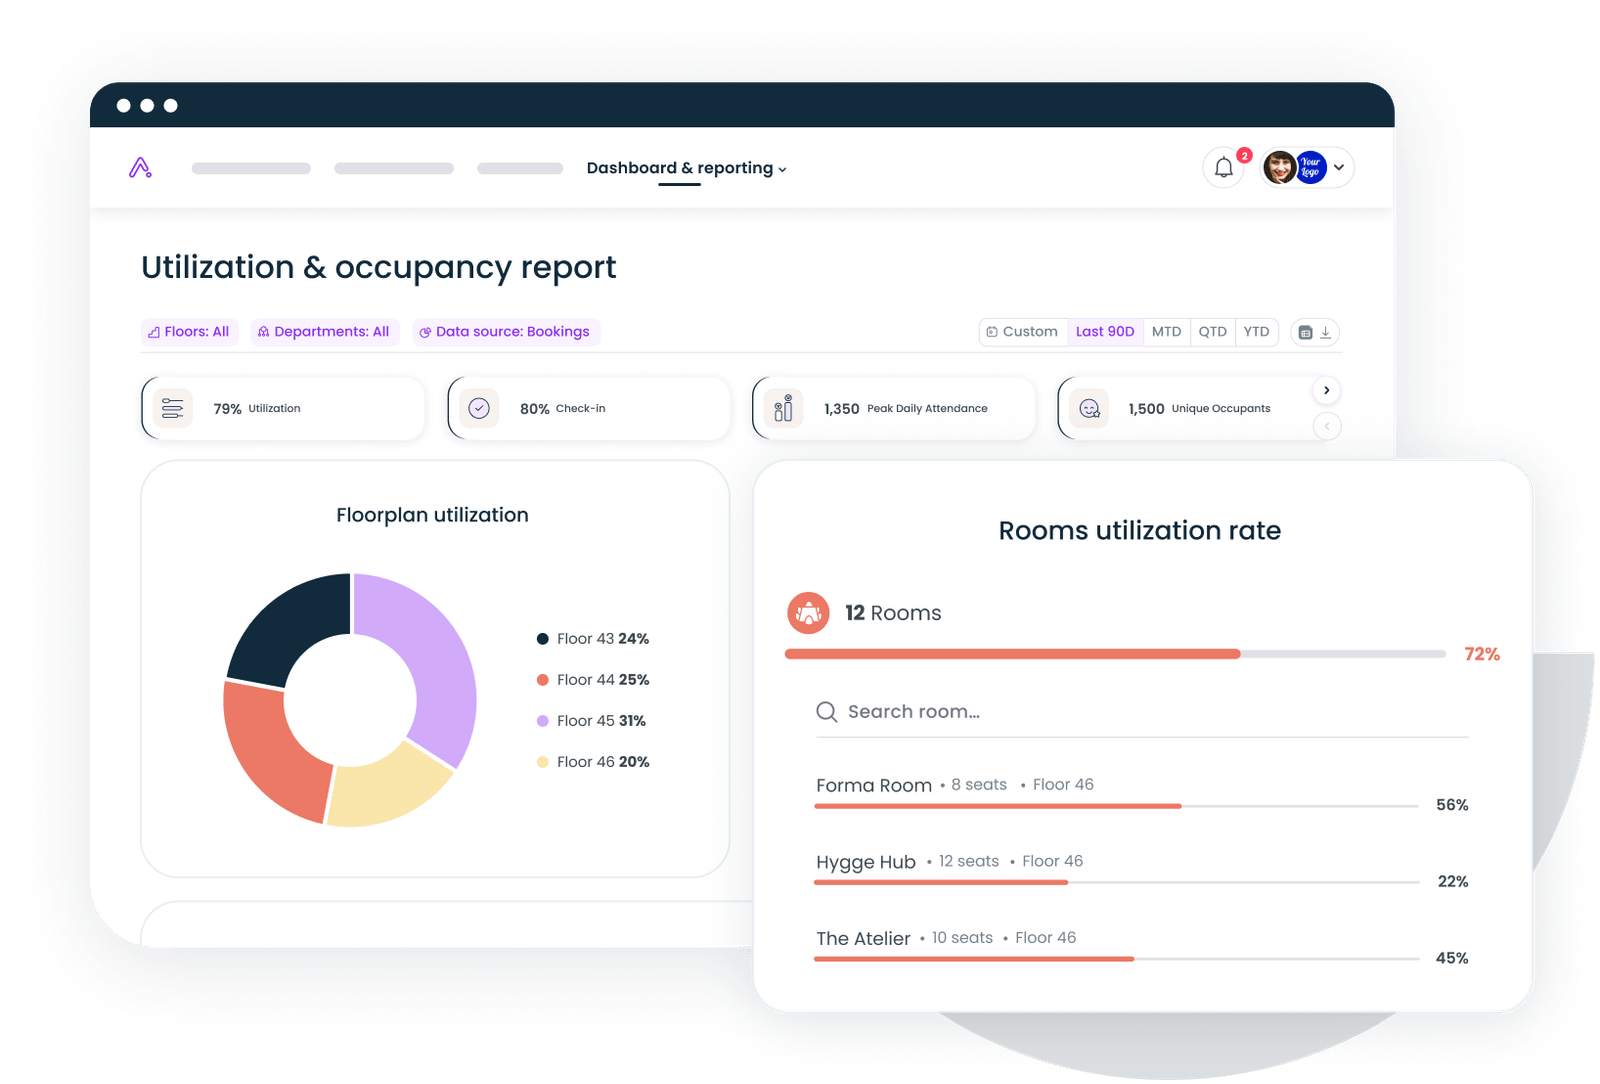
How to calculate cost per desk (step-by-step)
Step 1: Add up all workspace costs
Start with your lease. If you're renting, it's the monthly rate times 12. If you own the building, use the annual depreciation plus operating expenses.
Then add:
- Utilities: electricity, water, gas, trash collection
- Furniture: desks, chairs, storage, break room equipment
- IT: wifi infrastructure, monitors, cables, docking stations
- Cleaning and maintenance: janitorial contracts, HVAC servicing, repairs
- Insurance and taxes: property insurance, local property taxes
Don't include salaries or benefits. Cost per desk measures space, not people.
Example: A 10,000 sq ft office in Austin costs $35 per sq ft annually. That's $350,000 in rent. Add $40,000 for utilities, $30,000 for furniture depreciation, $20,000 for IT, $25,000 for cleaning, and $15,000 for insurance. Total: $480,000.
Step 2: Count your desks
Walk the floor. Count every usable workstation. Assigned desks, hot desks, benching setups, private offices, anything someone sits at to work.
Don't count:
- Conference room seats
- Phone booths or focus pods (unless they're bookable as workstations)
- Breakout lounges
- Reception desks
If you have 60 assigned desks and 20 hot desks, you have 80 desks.
Step 3: Divide total costs by desk count
$480,000 ÷ 80 = $6,000 per desk per year.
That's your cost. In a city like Austin, $6,000 per desk is below average, most companies land between $8,000 and $12,000. In San Francisco or New York, you're looking at $12,000 to $18,000.
Step 4: Compare cost per desk to utilization
This is where the formula breaks. Knowing you spend $6,000 per desk means nothing if only 50% of those desks get used during the week. You're paying $12,000 per used desk.
Track badge swipes, booking data, or sensor counts to see which desks get used. If peak occupancy is 60%, you're carrying 40% excess capacity. Either reduce your footprint or redesign the space to match demand.
Gable's occupancy analytics combine booking patterns with badge data to show you real utilization across floors, neighborhoods, and desk types. You'll know which areas are overbuilt and which need more capacity.
Cost per desk benchmarks by market (2026)
Cost per desk varies by city, building quality, and how much space you allocate per person. Here's what companies are paying in major metros, based on data from CBRE and JLL.
Top-tier markets:
- San Francisco: $15,000-$18,000
- New York (Manhattan): $14,000-$17,000
- Boston: $12,000-$15,000
- Seattle: $11,000-$14,000
- Los Angeles: $10,000-$13,000
Mid-tier markets:
- Austin: $8,000-$11,000
- Denver: $8,000-$10,000
- Chicago: $9,000-$12,000
- Atlanta: $7,000-$9,000
- Dallas: $7,000-$9,000
Lower-cost markets:
- Phoenix: $6,000-$8,000
- Nashville: $6,000-$8,000
- Salt Lake City: $5,500-$7,500
- Charlotte: $6,000-$8,000
These numbers assume 150-200 sq ft per desk (including shared amenities). If you're running a tight layout at 100 sq ft per desk, you'll land at the low end. If you're allocating 250 sq ft per person with lots of collaboration zones, expect the high end.
Hybrid work doesn't change cost per desk much, it changes utilization. A $12,000 desk in Seattle costs the same whether someone sits there five days a week or two. The difference shows up in how much space you need.
See where your cost per desk lands against companies your size in your region. Gable's workspace spend benchmarks give you real data on what peers are paying.
Get spend benchmarks
Why cost per desk doesn't tell the full story
Cost per desk treats every seat equally. It doesn't account for how often desks are used, who's using them, or whether the space supports the work people actually do.
Three reasons the metric falls short:
1. Utilization matters more than capacity
A company with 100 desks at 80% utilization is more efficient than one with 50 desks at 40%. Cost per desk says the smaller company is leaner. Occupancy data says otherwise.
If you're spending $10,000 per desk and utilization is 50%, your effective cost per occupied desk is $20,000. That's expensive by any measure.
2. Hybrid schedules create uneven demand
Monday and Thursday see 60% occupancy. Tuesday hits 80%. Wednesday and Friday drop to 30%. Cost per desk averages these out, which hides the fact that you're overbuilt for most of the week and undersized on peak days.
Predictive analytics let you forecast demand by day and adjust desk ratios accordingly. Some companies run 0.6 desks per employee and hit 90% utilization on busy days without turning people away.
3. Flex space changes the math
Paying $200-$500 per desk per month at a coworking space costs more per seat than a traditional lease. But you're not locked into a five-year commitment, and you don't pay for desks when headcount drops.
For distributed teams, flex works out cheaper. Instead of leasing 50 desks in one city to cover 20 local employees, you give everyone a coworking stipend and pay only for what they use. Cost per desk goes up. Total workspace spend goes down.
Gable's on-demand workspace network gives employees access to 7,000+ spaces in 120 countries. You pay per booking, so cost per desk becomes cost per visit, and you're not carrying fixed overhead.
How to use cost per desk to optimize your office
Calculating cost per desk is useful. Using it to drive decisions is better.
1. Right-size your footprint
If your cost per desk is $12,000 and utilization is 40%, you're wasting $288,000 annually on empty seats (40 unused desks × $12,000). Shrink your lease by 30%, keep the same peak capacity, and you'll save six figures without turning anyone away.
Start by tracking badge swipe data for three months. Find your 90th percentile occupancy day, the day when more people show up than 90% of other days. That's your capacity target. If it's 60 desks and you have 100, you're overbuilt by 40%.
2. Shift to hoteling
Assigned seating inflates cost per desk because you're paying for a desk whether the person shows up or not. Office hoteling lets multiple people share the same seat across different days.
With a 0.7 desk-to-employee ratio, 100 employees need 70 desks instead of 100. At $10,000 per desk, that's $300,000 in annual savings. Hoteling works when your team is hybrid and peak occupancy stays below 75%.
Gable's desk booking software handles reservations, sends reminders, and shows real-time availability so no one fights over seats.
3. Convert unused desks into meeting rooms
If desks sit empty but your conference rooms book out weeks in advance, you're solving the wrong problem. Companies with hybrid teams need more collaboration space and fewer assigned desks.
Reallocate 20% of your desks into focus rooms, huddle spaces, and small meeting rooms. Cost per desk goes up (fewer desks, same total cost). Total workspace efficiency improves because you're supporting the work people actually do in the office.
4. Use flex space for overflow and distributed employees
If you have employees in 10 cities and fewer than five per location, leasing an office in each market makes no sense. Cost per desk would be astronomical once you factor in unused seats.
Give them coworking access instead. Flex space costs more per visit than a leased desk costs per day, but you're not carrying fixed overhead in low-density markets. For a team of three in Denver using coworking twice a week, total monthly cost is $600-$1,200. Leasing an office for them would run $3,000+ per month minimum.
Gable's distributed workspace management gives you one platform to handle HQ desk bookings, coworking reservations, and utilization data across every location.
5. Benchmark against companies your size
Knowing your cost per desk is $11,000 means little without context. Is that high? Low? Are you overpaying?
Compare your number to other companies in your industry and region. If peers are paying $8,000 per desk and you're at $14,000, either your space is inefficient or you're in a premium building that's not worth the premium.
Gable's workplace spend benchmarks show what companies your size pay per employee, per desk, and per square foot. You'll see where your spend sits relative to peers and where you can cut without downgrading quality.
Gable connects occupancy data, booking patterns, and cost metrics in one dashboard. See where you're overpaying, where you're undersized, and what changes will save the most.
See the platform