.svg)


.svg)
- Most companies collect occupancy data but can't predict what's coming next week
- Five concrete steps turn historical booking and badge data into space forecasts
- You need roughly two years of clean data to build a reliable model
- Integrated platforms outperform stitched-together point solutions for forecasting accuracy
- Expect 10% to 25% ROI in year one from right-sizing decisions alone
74% of organizations collect utilization data, but only 7% rate their data capabilities as excellent. That's the gap predictive workplace analytics closes. Go beyond dashboards and prettier charts. The goal is the ability to look at next Tuesday and know, with reasonable confidence, whether your 40-desk floor will see 8 people or 38, and what to do about either scenario.
What predictive workplace analytics means for hybrid offices
Three words get thrown around interchangeably, and they shouldn't. Descriptive analytics tells you what happened: "Floor 2 averaged 43% occupancy last quarter." Diagnostic analytics tells you why: "Marketing's shift to remote Fridays dropped that number 11 points." Predictive analytics tells you what's coming: "Based on badge data, booking trends, and the Q3 planning cycle, Floor 2 will hit 72% capacity on Tuesdays in September."
Global office utilization hit 54% in 2025, up from 41% two years earlier. That's a fast-moving target. If you're making lease decisions based on last year's averages, you're either overpaying for ghost space or scrambling to find desks when teams show up. Predictive models let you plan for the trend, not react to it.
The financial impact is concrete. A 300-person company paying $45 per square foot that right-sizes even one floor based on accurate forecasts saves six figures annually.
Step 1: Define the questions you're trying to answer
Skip the temptation to "do analytics" as a project. Start with a list of decisions you need to make in the next 6 to 12 months. Renewing a lease? You need occupancy forecasts by floor and day of week. Redesigning a floor plan? You need meeting room demand by size and time block. Considering a coworking budget for remote employees? You need geographic clustering data.
Write down three to five specific questions. Here's what good ones look like:
- "Will we need all four floors when our lease renews in March?"
- "Which days will exceed 80% desk capacity next quarter?"
- "Are our 12-person conference rooms worth their square footage?"
That last one matters more than you'd expect. 80% of meetings happen in rooms built for 6 or fewer people, while boardrooms sit at 12% utilization. If your predictive model confirms that pattern will hold, you've found 800 square feet to repurpose.
Map each question to the data sources you'll need. Lease renewal questions require badge and occupancy data. Floor plan redesigns need room booking patterns. This mapping prevents the most common failure mode: collecting everything and analyzing nothing.
Step 2: Audit and integrate your data sources
Bad data in, bad predictions out. That's the reason most first attempts at workplace analytics stall. Before you build any model, you need to know what data you have, where it lives, and how clean it is.
The five core data sources
- Badge and access control data captures when people physically enter the building. It's your most reliable signal for attendance, but it misses tailgaters and doesn't tell you where someone sat.
- Desk and room booking data shows intent. The gap between bookings and usage (no-shows) is itself a valuable metric. If 30% of desk reservations go unfulfilled, your "demand" numbers are inflated by a third.
- WiFi connection logs fill the gap between badge swipes and booking records. They reveal dwell time, floor-level movement, and which zones get foot traffic versus which collect dust.
- HRIS data gives you the organizational layer: departments, locations, reporting structures, hire dates. Without it, you can see that Floor 3 is busy on Wednesdays but not that it's because the product team has a standing sync.
- Calendar and meeting data rounds out the picture. Back-to-back meetings in a specific building signal collaboration density. Recurring events create predictable demand spikes.
The integration challenge
Most companies store these in five different systems that don't talk to each other. Badge data in Brivo, bookings in one tool, HRIS in Workday or Rippling, WiFi logs in an IT dashboard. The first real work of predictive analytics is connecting these streams into a single dataset with a common employee identifier.
One corrupted field, say a department name spelled three different ways across platforms, throws off every downstream analysis. Spend a week on data hygiene before you spend a month on models. Check for duplicates, standardize naming conventions, and verify that timestamps align across sources.

Before building predictive models, make sure you're tracking the right [space utilization metrics](https://www.gable.to/blog/post/space-utilization-metrics). Our complete guide breaks down every KPI workplace leaders need.
Read the guide
Step 3: Collect enough historical data to spot patterns
Here's the uncomfortable truth about predictive models. Organizations generally need at least two years of comprehensive employee data to build reliable ones. Six months of badge swipes won't capture seasonal patterns, annual planning cycles, or the difference between a Q1 hiring push and Q3 budget freeze.
If you don't have two years of clean data, start collecting now and use simpler heuristic models in the interim. A heuristic model isn't fancy: "Tuesdays and Wednesdays run 20% above the weekly average, Fridays run 35% below." That won't win any data science awards, but it's more useful than guessing.
What to look for in your historical data
- Day-of-week patterns. Nearly every hybrid company has peak days (usually Tuesday through Thursday) and valley days. Quantify the spread. If your peak is 2.5x your valley, that's a fundamentally different planning problem than a 1.3x spread.
- Seasonal cycles. Summer months, December holidays, fiscal year-end sprints. A tech company analyzed cafe occupancy by timeframe, then ran predictive algorithms to forecast next week's traffic. The same principle applies to desks and meeting rooms.
- Growth and attrition trends. Headcount isn't static. If you added 50 people in the last year, raw occupancy numbers trend up even if per-capita usage stayed flat. Normalize for headcount changes.
- Event-driven spikes. All-hands meetings, quarterly business reviews, team offsites. These create outlier data points that can skew averages if you don't flag them.
Build a simple spreadsheet that tracks weekly occupancy by floor, day, and department for at least the last 12 months. Even before applying any algorithm, you'll see patterns that inform your office space planning.
Step 4: Choose the right tools and build your first model
You don't need a data science team. You do need a platform that consolidates your data sources and surfaces patterns without requiring SQL queries.
Three tiers of analytical capability
- Tier 1: Reporting. Dashboards that show what happened. Useful but backward-looking. If you're here, you're doing descriptive analytics only.
- Tier 2: Pattern detection. Tools that identify recurring trends, flag anomalies (a floor that's suddenly 40% busier), and segment by department or day. This is diagnostic plus basic prediction.
- Tier 3: Forecasting. Models that project future demand, simulate scenarios ("What if we close Floor 4?"), and recommend actions. This is where predictive workplace analytics lives.
Most workplace management platforms operate at Tier 1 or 2. The jump to Tier 3 requires integrated data (which is why Step 2 matters so much) and either built-in AI or a connection to your BI tools.
Building your first forecast
Start simple. Pick one question from Step 1 and one floor or location. Pull 12 months of daily occupancy data. Plot it. Look for the obvious patterns first: weekly cycles, monthly trends, holiday dips.
Then apply a basic time-series forecast. If you have Excel, the FORECAST.ETS function handles seasonal data reasonably well. If you have access to a platform with AI-powered insights, even better: let it detect seasonality, weight recent data more heavily, and account for variables like headcount changes.
Industry research on AI-driven forecasting consistently shows accuracy gains of roughly 10% with corresponding cost reductions of up to 15% and service-level improvements in the same range. Those numbers aren't workplace-specific (most cross-industry research comes from supply chain and operations), but the math translates. Better demand prediction means less wasted space and fewer days where people can't find a desk.
Gable Offices does this by pulling together desk booking data, access control integrations (Brivo, WiFi), and HRIS feeds into a single analytics layer with AI-powered recommendations. You ask the AI chat a question like "Which floors will exceed capacity next month?" and get an answer, not a dashboard you have to interpret.
Gable Offices combines desk and room booking, access control, WiFi, and HRIS data into one platform with AI insights, so you can forecast demand without stitching together point solutions.
Learn more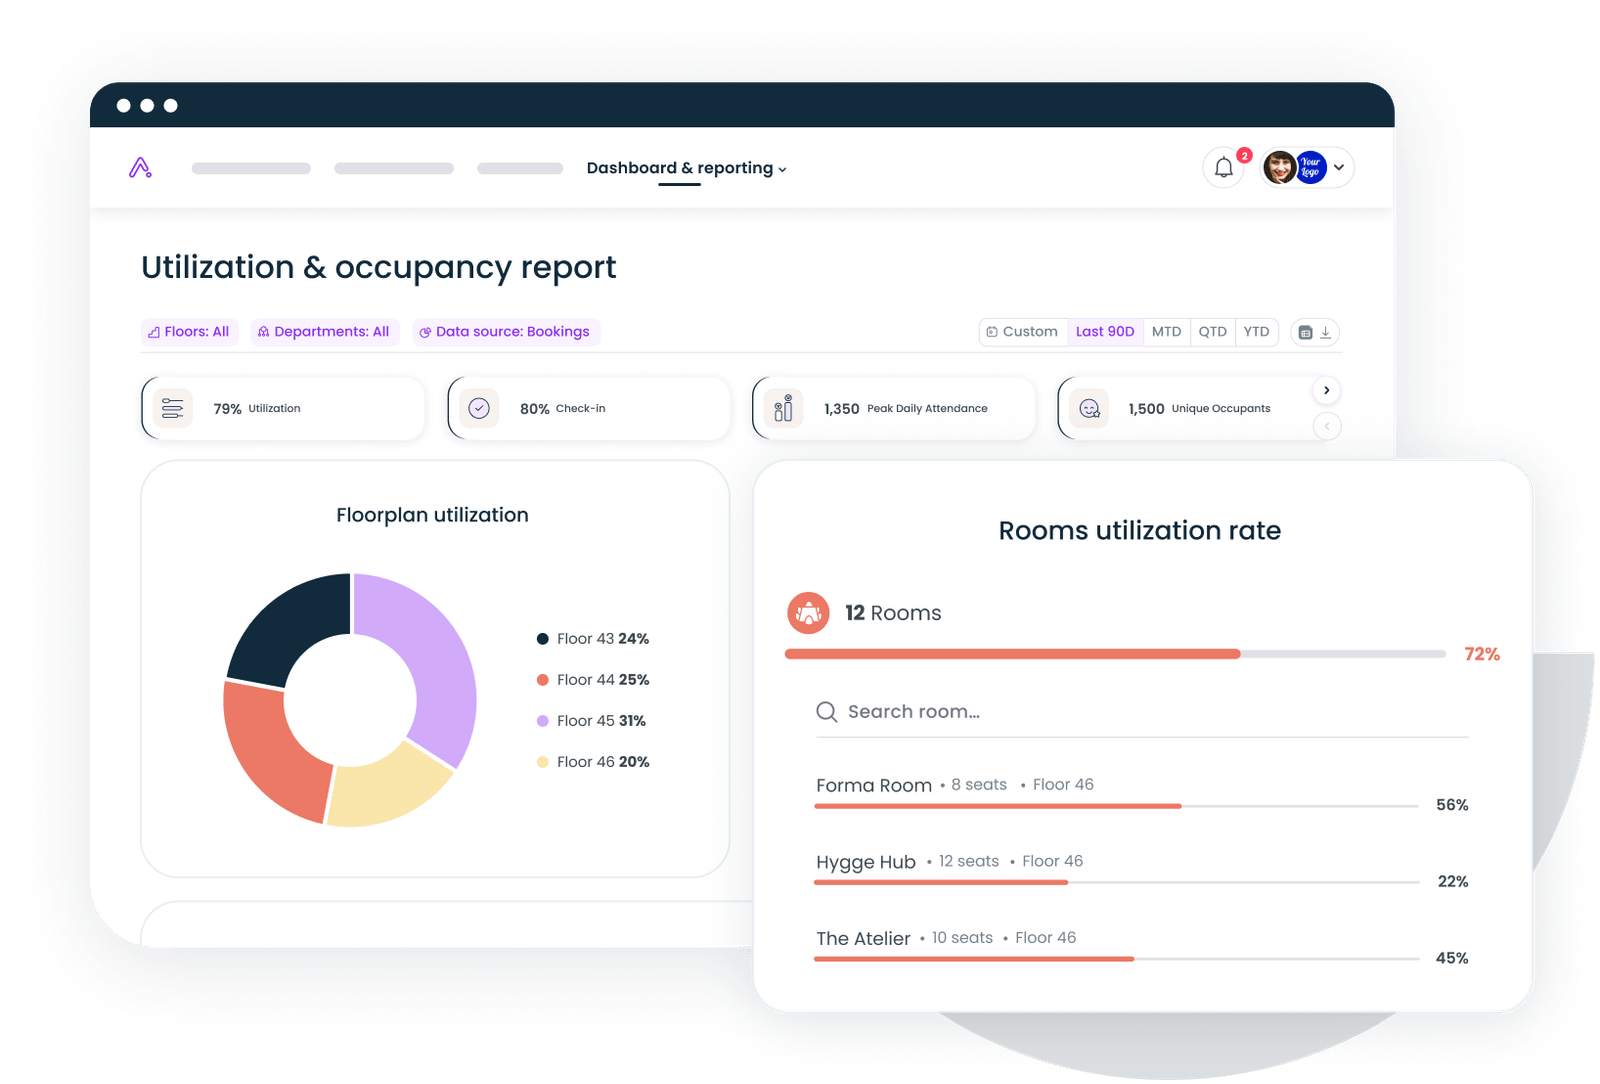
Step 5: Monitor, measure, and refine continuously
Your first model will be wrong. That's fine. The value comes from being directionally right and getting more accurate over time.
The metrics that tell you if it's working
- Forecast accuracy. Compare predicted occupancy to actual occupancy weekly. If your model said Floor 2 would hit 65% on Wednesday and it hit 61%, that's a 4-point miss. Track the average miss over time. Getting below 10% deviation consistently means your model is reliable enough for lease decisions.
- No-show rate. The gap between booked desks and usage. A dropping no-show rate means employees trust the system. A rising one means your "demand" data is inflating.
- Cost per seat per day. Divide total facility costs (lease, utilities, amenities, cleaning) by occupied seats. Not total seats. Occupied seats. This number should trend down as you right-size spaces based on predictions.
- Peak utilization versus capacity. Your busiest day shouldn't exceed 85% of available desks. If your model predicts it will, you have time to open overflow space or adjust schedules before people start working from hallways.
The feedback loop
Plan, enable, measure, improve. Run your predictions weekly. Compare to actuals every Friday. Adjust weights monthly. Did a new team join that floor? Update the headcount variable. Did the company shift to four-day weeks? Retrain on recent data.
Organizations implementing comprehensive office space optimization typically see ROI ranging from 10% to 25% in the first year. Year two is where it compounds: your models are sharper, your data is cleaner, and your facilities team stops guessing about which floors to keep open.
Common pitfalls that derail predictive workplace analytics projects
- Treating hybrid patterns as static. The Tuesday-Wednesday-Thursday peak that held last year might shift when a major team moves to a different schedule. Weight recent data more heavily than data from 18 months ago.
- Ignoring the denominator. Occupancy percentages are meaningless without knowing total capacity. If you removed 20 desks from Floor 3 last month, a "spike" in utilization percentage might be math, not demand.
- Siloed ownership. Workplace teams collect badge data, IT owns WiFi logs, HR controls the HRIS, and finance tracks lease costs. If nobody owns the integrated dataset, nobody builds the model. Assign a single owner with access to all five data sources from Step 2.
- Over-engineering the model. A 95% accurate model that takes six months to build is less valuable than a 75% accurate model you deploy next month. Start with the simple time-series approach, prove value, then invest in sophistication.
- Forgetting to communicate results. The best forecast in the world doesn't matter if the VP of Real Estate never sees it. Build a weekly one-page summary: predicted versus actual occupancy, cost-per-seat trend, and one recommended action. Industry research suggests organizations see strong returns (often cited in the range of $13 for every dollar spent) on workforce planning analytics, but only when leaders act on the insights.
Where predictive models meet real estate decisions
The endgame is the moment your CFO asks "Can we give back a floor?" and you have the data to answer confidently.
A 500-person company occupying three floors at $50 per square foot can model three scenarios: keep all three floors (baseline), consolidate to two floors with hot-desking (aggressive), or keep three floors but reconfigure one for event and collaboration space (moderate). Predictive data tells you which scenario matches demand patterns. Without it, you're negotiating a five-year lease based on a hunch.
That's where this work pays for itself: in the lease negotiation, the floor plan redesign, and the budget conversation where you walk in with 18 months of forecast data showing exactly how much space your team needs on any given day.
The facilities team at that 500-person company that sees Floor 3 hitting 12% occupancy every Friday doesn't need a consultant. They need a model that confirms the pattern holds, projects it forward, and gives them the confidence to act.
Gable brings your booking, badge, WiFi, and HR data together in one platform, so your team can predict space demand without building models from scratch.
Get a demo