.svg)


.svg)
- Global office utilization hit 53% in 2026, making portfolio-level visibility non-negotiable
- Tuesday occupancy peaks at 58.6% while Friday drops to 34.5%, and most companies manage this blind
- 72% of workspace bookings happen for team gatherings, not solo desk work
- 40% of booked meeting rooms go unused due to no-shows across locations
- Desk-to-employee ratios of 1.5:1 or 2:1 only work when driven by per-site data
Running five offices like five separate problems is the most expensive mistake a workplace team can make in 2026. Managing multiple office locations requires portfolio-level thinking, where every lease, every booking pattern, and every utilization metric feeds a single operating picture. With 64% of companies now operating hybrid models and office utilization climbing to 53% globally, the playbook has shifted from "keep the lights on everywhere" to "make every square foot justify its existence."
What multi-location management means in a hybrid world
A decade ago, multi-location management meant replicating the same office model in different cities, keeping each location stocked, and flying leadership in for quarterly town halls. That model assumed 80%+ daily occupancy, predictable headcount growth, and employees who showed up five days a week.
None of those assumptions hold. When your Denver office sees 70% occupancy on Tuesdays but 22% on Fridays, while Austin runs the opposite pattern because the engineering team clusters there mid-week, you're managing a dynamic portfolio that shifts weekly based on team schedules, project cycles, and preferences. A solid workplace strategy accounts for this variability instead of pretending it doesn't exist.
With one location, you can walk the floor and adjust in real time. Across four or eight sites, decisions get made on lagging data, assumptions from the loudest site manager, or gut feel shaped by whichever office the CEO visits most often.
The three challenges that break multi-location operations
Communication that compounds, not degrades
Communication doesn't degrade linearly with distance; it compounds. A two-location company might miss the occasional cross-team update, but a five-location company across three time zones will develop separate information ecosystems within six months if left unchecked.
Gallup's engagement research shows hybrid and remote workers reporting 35-36% engagement versus 20-30% for fully on-site employees. The communication challenge isn't about where people sit. It's about whether the management layer between locations is deliberately designed or accidentally inherited. Most companies inherit it, and Chicago learns about a New York policy change two weeks late.
Cultural fragmentation that surfaces in retention data
Each office develops its own micro-culture whether you plan for it or not. The question is whether employees in every location feel equally connected to the company's mission, equally informed about career paths, and equally likely to stay. When Portland runs at 18% annual turnover and Dallas at 31%, the gap rarely traces back to compensation alone. More often it's inconsistent onboarding, uneven access to leadership, or recognition programs that favor the headquarters crowd.
Coordination complexity that eats operational bandwidth
Scheduling a cross-location workshop for 40 people from three offices involves room availability checks in each building, travel for the host site, AV setup for 12 remote joiners, catering across dietary requirements, and someone reconciling three different booking systems. Multiply that by the 15-20 cross-location events a mid-size company runs per quarter, and coordination becomes a full-time job disguised as "workplace operations." Building hybrid teams that function across these constraints requires deliberate infrastructure, not good intentions.
Portfolio intelligence: data, real estate, and the metrics that drive decisions
With global utilization at 53% (up from 38% in 2024, per CBRE), the average multi-location company is still leaving nearly half its leased space underused on any given day. But that 53% average obscures dramatic variation between locations, floors, and days of the week. Tuesdays consistently peak around 59% across industry benchmarks while Fridays drop below 35%, a gap wide enough that some companies could close an entire floor on Fridays and nobody would notice.
The smarter move involves understanding these patterns per location rather than applying a company-wide average. Your sales team in Atlanta might peak on Mondays (pipeline reviews), while your product team in Seattle clusters Wednesdays and Thursdays (sprint ceremonies). Tracking office occupancy rates by location, department, and day creates the foundation for every downstream decision: lease negotiations, furniture investment, cleaning schedules, and which locations justify a full-time facilities coordinator versus a shared one.
Desk ratios and meeting rooms: stop using company-wide averages
The industry has settled around 1.5:1 to 2:1 desk-to-employee ratios for hybrid organizations, but applying a single ratio across all locations ignores the data in your booking system. If San Francisco has 200 assigned employees averaging 65 on-site on the busiest day, a 3:1 ratio works fine there, freeing capital to add desks in Denver where 85% of assigned employees show up on Tuesdays. Office space planning becomes a portfolio optimization exercise at this point: shifting resources between locations based on demand curves rather than headcount allocations that treat every office identically.
Worklytics' research found that 80% of meetings happen in rooms sized for 6+ people while averaging only 2.6 attendees, with 40% no-show rates on booked rooms. Across multiple locations this mismatch multiplies: you're paying rent on conference rooms empty nearly half the time they're "booked," while employees complain they can't find a room. Auto-release policies, room-size matching, and cross-location analytics can reclaim 25-35% of meeting room capacity without adding a single square foot.
The metrics that tell you whether your portfolio is working
| Metric | What it tells you | Target range |
|---|---|---|
| Daily occupancy by location | Whether each office is right-sized | 60-80% on peak days |
| Desk-to-employee ratio (actual vs. planned) | Whether your ratio assumptions hold | 1.5:1 to 2.5:1 |
| Meeting room utilization (booked vs. used) | Ghost bookings and sizing problems | 60%+ of booked time |
| Peak vs. trough variance | How dynamic your space needs are | Under 30% variance = stable |
| Cost per productive sq ft | Real estate efficiency vs. spend | Compare across sites |
| Engagement score by location | Whether multi-location culture is working | 15+ point gaps = investigate |

Portfolio-level decisions start with understanding where your space dollars go and whether each location earns its lease. Our corporate real estate strategy guide breaks down the framework.
Read the strategy guide
The operational stack: tech, culture, and leadership
Multi-location infrastructure is only as useful as the connective tissue between sites. Three components determine whether your portfolio operates as a single system or five disconnected ones.
Unified booking and meeting infrastructure
When each office runs its own desk reservation tool (or a shared spreadsheet), cross-location visibility drops to zero. An employee flying from Chicago to Austin for a project sprint can't see which desks are open, whether the right conference room has video gear, or if parking is available. Desk booking software that spans all locations eliminates these blind spots while generating the utilization data your real estate team needs.
Standardizing AV setups across all locations ensures that a New York to Portland meeting delivers the same experience regardless of which room either group books. The investment runs $3,000-$8,000 per room, but a poorly run cross-location meeting wastes 8-12 people at a fully loaded cost of $75/hour, which is $600-$900 per occurrence. A company running 30 cross-location meetings per week recovers the AV investment within three months.
Culture: coherent, not uniform
Forcing identical culture across locations backfires. The things that make Denver's Friday run club meaningful won't translate to Miami's Thursday rooftop mixers. Coherence matters more than uniformity: shared principles expressed through locally relevant rituals. Company values, compensation philosophy, promotion criteria, and benefits stay consistent. How teams celebrate wins, organize social events, and structure on-site days can (and should) vary.
Onboarding equity ranks among the highest-ROI culture investments. If headquarters runs a structured two-week program with executive meet-and-greets and curated first-month experiences while satellite offices hand new hires a laptop and a Slack invite, you've built a two-tier culture that shows up in engagement surveys within 90 days. Standardize onboarding outcomes (not necessarily the exact format) so every new hire's perception of whether their office matters is shaped from day one.
Leadership: distributed authority with clear decision rights
Ambiguity about who decides what causes more multi-location failures than any lack of tools. When the Austin site manager and the VP of Workplace in New York both think they own the decision on adding phone booths to Austin, the result is either duplicated effort or paralysis. A decision rights matrix should specify, for each location: who owns space configuration changes, vendor relationships (and local discretion limits), policy exceptions, and budget allocation.
Monthly location reviews keep the system honest. Each site manager presents occupancy trends, employee feedback, and upcoming space needs to central workplace leadership. The format is data-driven: "Floor 2 averaged 41% occupancy in March, down from 48% in February, and here's what we're doing about it" beats "things are going well in Austin." Distributed team management applies as much to the workplace operations team itself as to the broader workforce.
Hybrid work when locations overlap with remote
The intersection of multiple offices and distributed remote employees creates a coordination challenge neither pure in-office nor pure remote playbooks address. When your PM in Portland works from home three days a week, visits Portland on Tuesdays, and flies to San Francisco for a quarterly sprint, they're navigating three different workplace experiences that need to feel cohesive.
Mandating specific in-office days generates pushback and doesn't account for cross-location travel. Better: team-level coordination where each team agrees on their "anchor days" when most members will be in a specific office, and the booking system surfaces this so other teams can plan cross-functional collaboration around it. The hybrid work model guide covers the spectrum from fully flexible to structured hybrid, and most multi-location companies land in the middle, with 2-3 suggested (not mandated) office days varying by team and location.
Employee experience consistency means that whether someone sits in Chicago headquarters, a coworking space in Nashville, or their home office in rural Vermont, they access the same core workplace technology: booking tools, communication platforms, IT support, HR systems. The gap most companies miss is the soft experience layer: finding a desk near their team when visiting another office, knowing the WiFi password and printer setup before arriving, and clear wayfinding in an unfamiliar building.
Gable connects desk booking, room scheduling, visitor management, and utilization analytics across all your offices, while giving distributed teams access to 20,000+ flexible workspaces globally.
Learn more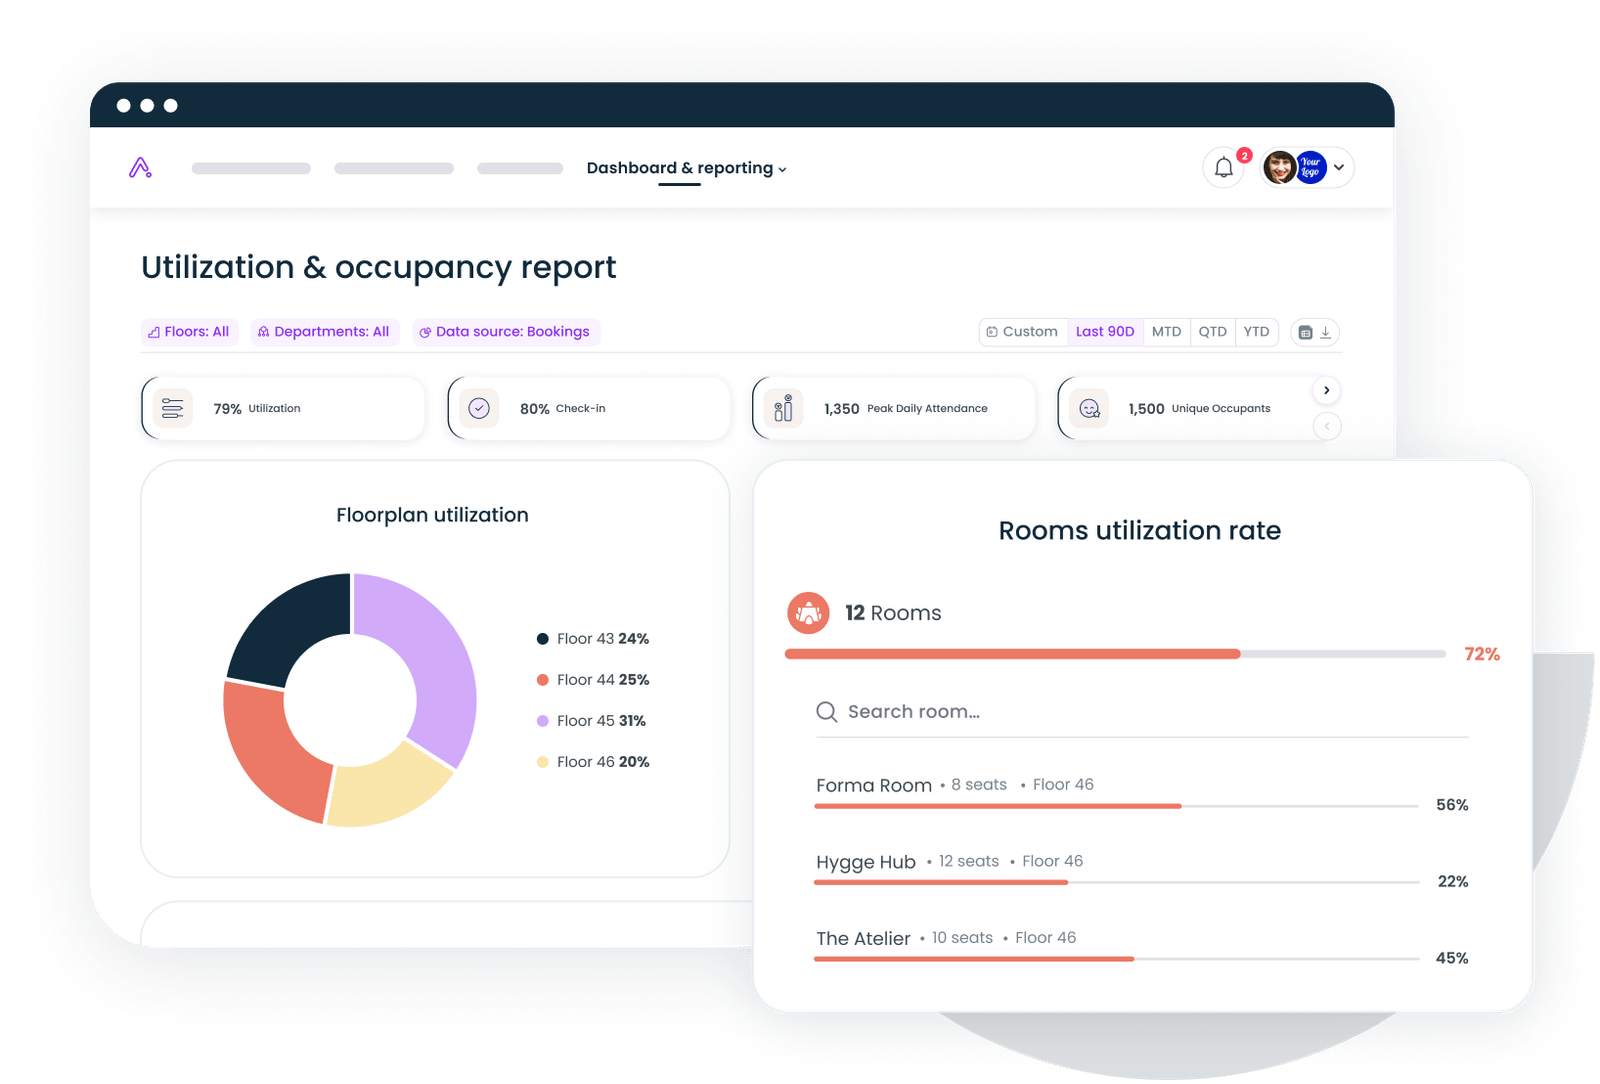
Real estate strategy: from portfolio view to monthly operations
Blended lease flexibility versus long-term lock-in
Signing 7-10 year leases for every location assumed stable headcount and predictable space needs. In a hybrid environment where occupancy fluctuates 25-40% week to week, that model traps capital. The alternative is a blended portfolio:
- Core leases (3-5 years) for locations with stable, high utilization (typically headquarters and primary talent hubs)
- Flexible leases (1-2 years) for secondary locations where team size or hybrid patterns are still stabilizing
- On-demand space for cities with 5-20 employees who need occasional co-location but don't justify a permanent office
This "core-flex" strategy lets companies scale space up or down without the $50-$150/sqft penalty of breaking a long-term lease.
Right-sizing based on demand, not headcount projections
If Chicago has 300 assigned employees but peak occupancy never exceeds 135 (even on the busiest Tuesday), you don't need space for 300. You need space for 135-160 (adding a 15-20% buffer), which might mean subleasing a floor, converting unused space to collaboration zones, or negotiating a partial lease reduction at renewal. Running this analysis for every location simultaneously surfaces the portfolio opportunities: Chicago over-spaced, Denver under-spaced, shift resources accordingly. At $50-$70/sqft, even modest right-sizing across 3-5 locations frees $200,000-$500,000 annually for a mid-size company.
Satellite offices and flex space as expansion tools
When you're hiring 15 people in a new metro area, "do we sign a lease?" should come after 6-12 months of data from flexible workspace usage. If those 15 employees book coworking an average of 3.2 days per week and cluster bookings on the same days, a small dedicated office starts to make sense. If bookings average 1.4 days per week scattered across the calendar, flex space remains the better bet. Gable's access to 20,000+ global flexible spaces lets companies test demand before committing capital.
Implementation roadmap: from audit to ongoing optimization
Phase 1: Audit (weeks 1-4)
Map your current state across every location: lease terms and costs, headcount versus available desks, utilization data (even if it's badge swipes rather than purpose-built sensors), employee satisfaction scores, and technology inventory. Most companies discover during the audit phase that they lack consistent data across locations, which itself is the first problem to solve.
Phase 2: Strategy and technology rollout (weeks 5-12)
With audit data in hand, define your target operating model: which locations are core versus flex, what desk ratios the data supports, where you're over-spaced and where you need capacity. Deploy a unified booking and space management platform across all locations simultaneously. Phased rollouts create an awkward period where some offices are on the new system and others aren't, defeating the purpose of cross-location visibility.
Phase 3: Training and continuous optimization (weeks 8+, ongoing)
Site managers need training on new tools and clarity on their role: executing a centrally defined strategy, or local autonomy within guardrails? That answer shapes everything from facilities budgets to space change requests. Monthly reviews of utilization data, quarterly adjustments to space configurations, and annual portfolio strategy reviews (aligned with lease renewal timelines) keep the system responsive. Companies that treat multi-location management as a "set it and forget it" exercise end up with a patchwork of over-leased offices and frustrated employees three years later.
Pulling it together
The shift from managing individual offices to managing a portfolio of workplaces is the defining operational challenge for workplace teams at companies with 200-5,000 employees. With utilization data mature enough to drive decisions (53% global average, granular day-of-week patterns, real-time room usage), the excuses for running each location in isolation have evaporated.
Getting this right takes three things: treating space as a dynamic resource rather than a fixed cost, investing in technology that provides cross-location visibility, and building leadership structures that balance local autonomy with portfolio-level optimization. None of this requires massive upfront investment. It requires commitment to measuring what happens in your offices and making decisions based on that data instead of last year's headcount plan.
Gable brings desk booking, space analytics, and flexible workspace access into a single platform built for multi-location teams. Let us show you how it maps to your portfolio.
Get a demo