.svg)


.svg)
Most companies running hybrid programs track attendance and call it measurement. That's like grading a restaurant by counting how many people walk through the door. The six metrics that predict hybrid success (productivity outcomes, collaboration quality, space utilization, engagement health, retention signals, and cost efficiency) require different tools and a fundamentally different mindset than what most workplace teams are using today. This guide walks you through what to track, how to set up systems that scale, and how to act on insights without crossing into surveillance territory.
54% of organizations report increased productivity from hybrid work. Only 22% have solid metrics to prove it, according to research from Omdia. That gap, between "we think this is working" and "here's exactly how we know," is where most hybrid programs quietly fall apart.
Not because the model is broken. Because nobody built the instrumentation to tell whether it's working, stalling, or slowly degrading.
Declining employee engagement cost the global economy $438 billion in lost productivity in 2024. Some of that damage happened inside companies that genuinely believed their hybrid programs were succeeding. They had anecdotal feedback, a few Slack polls, maybe a quarterly survey with a decent response rate. What they didn't have was a connected measurement system that could catch problems before they compounded into attrition, wasted real estate, or burned-out middle managers.
This guide is the measurement system most workplace teams skipped building. Here's how to construct one that tells you something useful.
Stop measuring attendance, start measuring outcomes
Badge swipes tell you who showed up on Tuesday. They tell you nothing about whether Tuesday was worth showing up for.
That distinction sounds obvious, but the majority of hybrid measurement programs still anchor on presence: days in office, check-in rates, compliance with mandated schedules. A 400-person company tracking badge data might celebrate 78% attendance on anchor days while completely missing that cross-functional collaboration dropped 30% because the wrong teams keep coming in on the wrong days.
Presence-based metrics made sense in 2019. Everyone was in the office five days a week, so measuring attendance was redundant by design, which meant nobody questioned whether it was a useful signal. Hybrid broke that assumption. When people split time between home, the office, and coworking spaces, physical presence becomes one data point among dozens, and not necessarily the one that matters most.
Stanford researcher Nicholas Bloom's landmark study at Trip.com, published in Nature in 2024, demonstrated what happens when you shift from attendance tracking to outcome measurement. Managers initially estimated that hybrid workers were 2.6% less productive. After the study introduced rigorous outcome-based measurement (task completion, project delivery, code commits, revenue performance) the same managers revised their estimates to +1% productivity. Same employees. Same work. Different measurement lens.
The shift matters because it changes what actions you take. If you measure attendance and see low numbers, your instinct is to mandate more office days. If you measure outcomes and see strong delivery with declining collaboration quality, your instinct is to redesign how teams coordinate, a fundamentally different intervention.
Outcome-based measurement doesn't mean you stop caring about where people work. It means you treat location as one variable inside a larger equation, not the equation itself. Where someone works is an input. What they accomplish, how well they collaborate, and whether they're burning out are the outputs that determine whether your hybrid program is succeeding.
The 6 core hybrid work metrics that matter
Every metric you add to your dashboard has a cost: someone has to collect it, interpret it, and decide what to do about it. Six is the ceiling before workplace leaders start drowning in data instead of acting on it.
These six cover the full surface area of hybrid performance. Miss any one and you've got a blind spot that will eventually show up as a budget surprise, a retention spike, or a real estate decision you can't defend to the CFO.
Notice what's missing from this table: hours logged, emails sent, Slack messages posted. Those are activity metrics. They measure motion, not progress. A product manager sending 200 Slack messages a day might be the most collaborative person on the team or the biggest bottleneck; activity data alone can't tell you which.
The six metrics above work as a system. Productivity tells you whether output is healthy. Collaboration tells you whether teams are functioning or fragmenting. Space utilization tells you whether you're paying for real estate nobody uses. Engagement tells you whether people are connected to the mission. Retention tells you whether the model is sustainable. Cost efficiency tells you whether you can afford it.
Pull on any single thread without the others and you'll optimize for the wrong thing. A company obsessing over space utilization might pack floors to 95% occupancy and wonder why engagement scores crater three months later.

Before you can measure success, you need a clear policy to measure against. Our step-by-step guide walks you through building a hybrid work policy that balances flexibility with accountability.
Read the hybrid work policy guide
How to measure productivity without micromanaging
Fifteen hours per week. That's the threshold where meeting load starts degrading individual productivity, according to Worklytics data. Above that line, deep work collapses, context-switching dominates the day, and employees start doing their real jobs after 6 PM.
The productivity measurement problem in hybrid isn't a lack of data. It's a trust problem. Install keystroke loggers and screenshot tools and you'll get pristine activity data alongside a destroyed culture. Teams that measure hybrid productivity well do it by tracking outcomes that employees can see, understand, and influence, not by surveilling inputs that breed resentment.
What to measure
- Goal attainment rate: Percentage of OKRs, KPIs, or sprint commitments delivered on time. Track by team, not individual, to avoid a surveillance dynamic.
- Project cycle time: How long initiatives take from kickoff to delivery. Rising cycle times in hybrid teams often signal coordination problems, not effort problems.
- Focus time ratio: The percentage of each week available for uninterrupted work. If your engineering team's average focus time drops below 40%, the issue isn't hybrid; it's meeting culture.
- After-hours activity: Calendar events and Slack activity after 7 PM, tracked at the team level. A persistent uptick is a burnout signal, not a productivity signal.
What not to measure
Screen time, app usage, mouse movement, or login duration. These metrics tell you whether someone's computer is active. They tell you nothing about whether the quarterly product launch will ship on time.
The practical distinction: a 300-person SaaS company tracking goal attainment rate at the team level discovers that their hybrid marketing team delivers 94% of sprint commitments while spending an average of 2.3 days per week in the office. Their fully in-office sales enablement team delivers 81%. The insight here is that hybrid scheduling isn't the variable holding sales enablement back. Something else is.
Measurement should create clarity for managers, not anxiety for employees. When you share the metrics you're tracking and why, you give people agency to improve. When you track metrics invisibly, you give people reasons to leave.
Track collaboration quality, not frequency alone
Twelve meetings in a day doesn't mean collaboration happened. It usually means the opposite: a calendar so fractured that real thinking gets pushed to nights and weekends.
Collaboration quality is the hardest hybrid metric to measure and among the most important to get right. Gallup's 2025 research found that 70% of the variance in team engagement stems directly from the manager, and manager effectiveness in hybrid depends heavily on whether their teams are connecting or occupying the same Zoom calls.
Signals that collaboration is working
- Cross-team interaction frequency. Are people from different departments working together, or are silos hardening? A product team that only interacts with other product people for three straight months is a silo forming in real time.
- Meeting effectiveness scores. Short post-meeting pulse (one question: "Did this meeting move work forward?") tracked over time. A 60% "yes" rate is a red flag.
- Decision velocity. How quickly does a cross-functional decision get made after the first discussion? In healthy hybrid environments, the answer is days. In broken ones, it's weeks of Slack threads, follow-up meetings, and "let's align offline."
- Gathering patterns. When employees book shared workspaces (coworking day passes, meeting rooms, offsite venues) are they doing it for team collaboration or solo focus? Gable data shows 72% of on-demand bookings are for team gatherings, which means most flex space usage is already collaboration-driven. Tracking that ratio over time tells you whether your hybrid model is fostering connection or isolating people.
Signals that collaboration is breaking down
- Same five people in every meeting. Collaboration has concentrated into a tiny node instead of distributing across the team.
- Rising meeting duration with stable or declining output. People are talking more and deciding less.
- Cross-functional projects requiring escalation to resolve dependencies that used to be simple. The informal hallway conversations that used to unblock work aren't happening, and nobody built a replacement.
Gallup's September 2025 research found that hybrid work models perform best when teams, not individuals, decide the norms. This applies directly to collaboration measurement: the right unit of analysis isn't "how collaborative is this employee" but "how well is this team connecting across locations and schedules?"
Engagement strategies that don't account for collaboration quality are flying blind. You can have a team of individually engaged employees who never work together effectively. Engagement surveys won't catch that. Collaboration metrics will.
Gable's Insights dashboard consolidates office utilization, flex workspace usage, and collaboration data into one view, with AI that surfaces recommendations before you have to ask.
Explore Gable Insights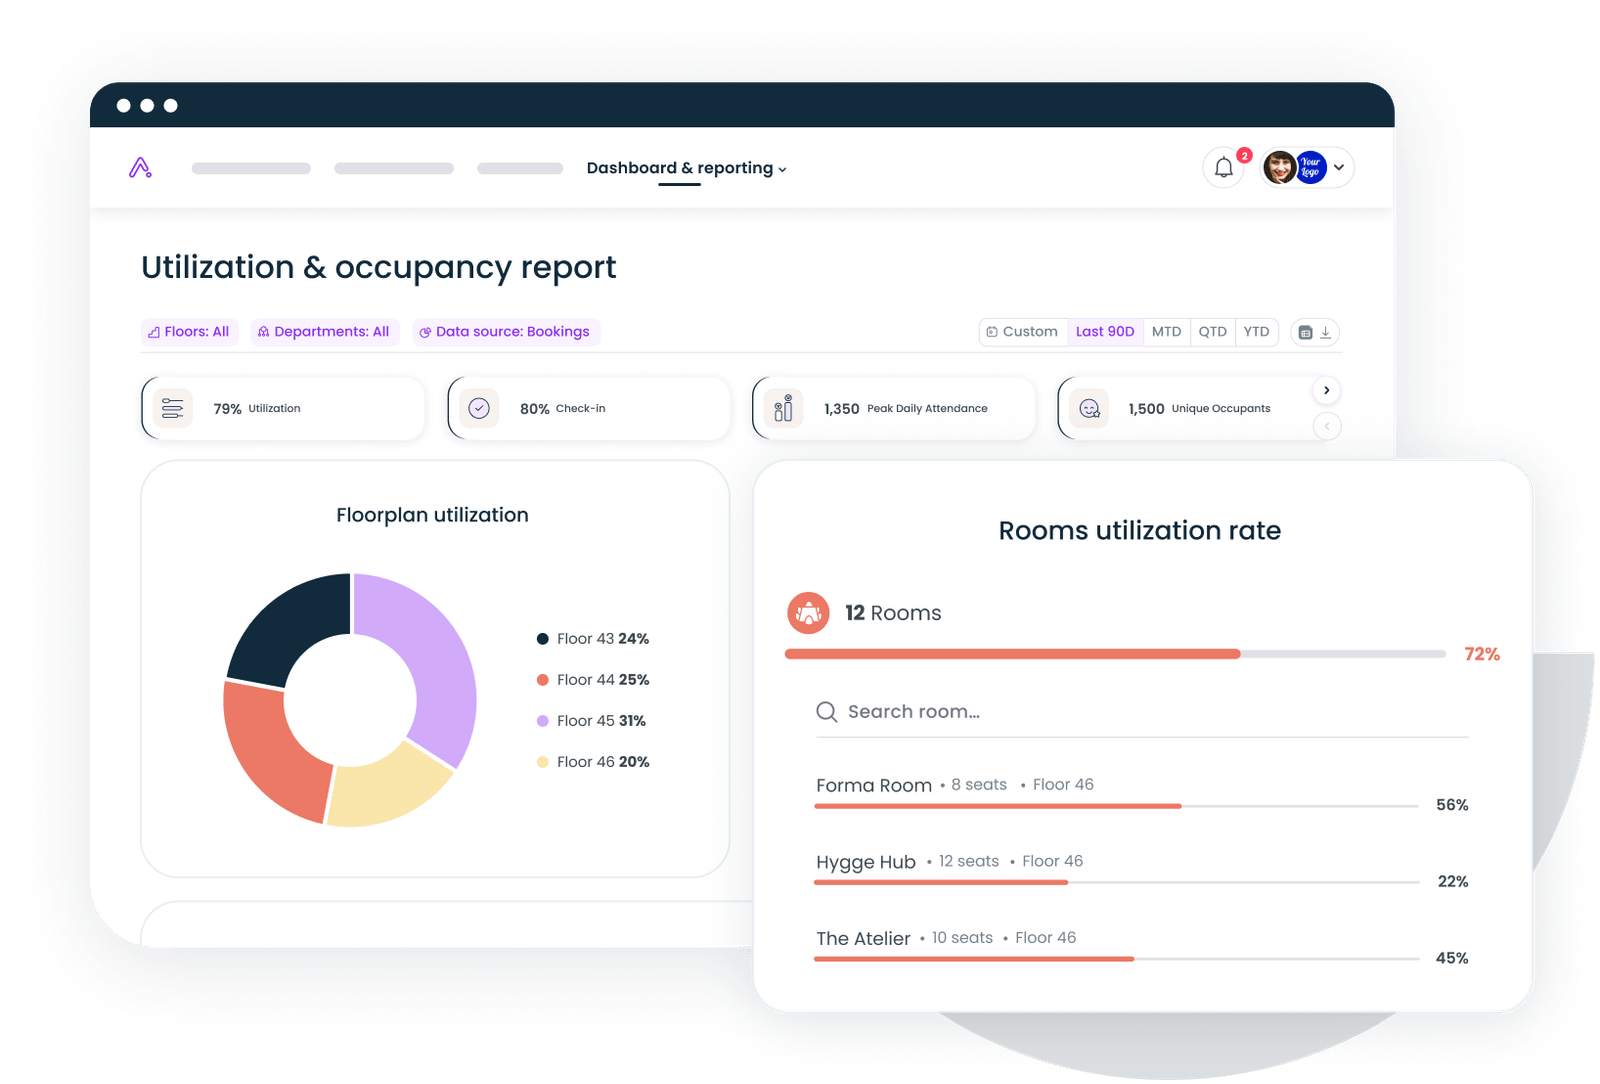
Use space utilization data to optimize real estate costs
A 200-person company leasing 40,000 square feet of office space at $55 per square foot pays $2.2 million annually. If average occupancy is 42%, which is close to the post-pandemic norm for hybrid companies, they're effectively paying $1.28 million per year for empty desks.
Space utilization data turns that vague sense of "we probably have too much space" into a specific, defensible number your CFO can act on. And in hybrid environments, the metrics that matter look different from traditional facilities management.
The metrics to track
- Peak-day occupancy. Most hybrid companies see Tuesday and Wednesday peaks, with Friday dropping to 15–25% occupancy. Knowing your peak isn't optional; it determines the minimum space you need.
- Desk utilization rate. Not how many desks are assigned, but how many are used on a given day. A floor with 80 assigned desks and 30 people showing up has a 37.5% utilization rate. That floor is a cost problem.
- Room booking-to-usage ratio. Meeting rooms booked but never used, or "ghost bookings," are endemic in hybrid offices. If 40% of your room bookings go unused, you don't need more rooms. You need better booking enforcement or smaller rooms.
- Space type demand. Are employees booking collaborative spaces (meeting rooms, team zones) or focus spaces (quiet rooms, phone booths)? The ratio tells you how to redesign your floor plan.
A facilities team at a 500-person company sees Floor 3 hitting 12% occupancy every Friday. They don't need a consultant to tell them what to do. They need data that confirms the pattern is persistent, not a one-week anomaly, and then they need to consolidate Friday operations to Floors 1 and 2.
The cost optimization opportunity is enormous, but only if you're tracking at the right granularity. Monthly averages hide the peaks and valleys that drive real estate decisions. Daily data by floor, by space type, by team; that's what lets you right-size your portfolio without disrupting the teams that use the space.
Office space planning without utilization data is guesswork. With it, you can model scenarios: What if we sublease Floor 3? What if we convert 20 fixed desks to hot desks? What if we shift our Tuesday anchor day to Wednesday and balance the load? Each scenario has a dollar value attached, and the data lets you calculate it before committing.
Set up a hybrid work measurement system that scales
Knowing what to measure is the easy part. The hard part, and where most hybrid programs stall, is building the system that collects, connects, and surfaces insights without requiring a full-time analyst to babysit it.
Step 1: Choose 3–4 metrics to start
Six metrics is the full framework. Nobody should launch all six simultaneously. Pick the three that align to your most urgent questions. If leadership is questioning hybrid ROI, start with productivity outcomes, space utilization, and cost efficiency. If attrition is climbing, start with engagement health, retention signals, and collaboration quality.
Step 2: Map each metric to a data source
The critical integration: your HRIS, your workspace booking system, and your access control data need to talk to each other. Without that connection, you're manually stitching spreadsheets, which means the data is always two weeks stale by the time anyone looks at it. Connecting workplace analytics to HR data lets you slice utilization by department, location, seniority, and team, which is where the real insights live.
Step 3: Set a review cadence
- Weekly: Space utilization (spot anomalies fast).
- Monthly: Productivity outcomes, collaboration quality, cost efficiency.
- Quarterly: Engagement health, retention signals, full portfolio review.
Weekly reviews should take 15 minutes. If your utilization dashboard requires more than that, the dashboard is wrong, not your schedule.
Step 4: Define action thresholds, not benchmarks alone
A benchmark tells you that 60% desk utilization is "good." An action threshold tells you that when a specific floor drops below 40% utilization for three consecutive weeks, you trigger a review with the facilities team and the department heads assigned to that floor. Thresholds prevent data from becoming decoration.
Step 5: Share metrics openly
This is where trust either builds or breaks. Share the metrics you're tracking, why you chose them, and what you're learning, with employees, not leadership alone. A company that shows its teams, "Here's what our collaboration data looks like, and here's what we're doing about it" builds psychological safety around measurement. A company that tracks the same data behind closed doors and then announces policy changes based on it builds resentment.
The workplace management platforms that work best unify these data streams into a single view. When your desk booking data, WiFi occupancy signals, HRIS team structures, and on-demand workspace invoices all live in one system, you stop debating whose spreadsheet is right and start debating what to do next.
Common measurement mistakes to avoid
Tracking too many metrics at once. A workplace team that launches with 15 KPIs will report on all of them for one quarter and then quietly stop reporting on any of them. Start with three. Add the fourth after the first three are producing actionable insights and have established owners.
Confusing activity with outcomes. Slack messages sent, emails opened, hours on VPN: none of these are outcomes. They're exhaust from work, not evidence of it. A team that sends 40% fewer messages but ships projects two weeks faster hasn't gotten lazier. They've gotten more efficient.
Applying one framework across all roles. A software engineer's hybrid productivity signals look nothing like a recruiter's, which look nothing like a sales rep's. Goal attainment rate works for all three, but the goals and the cadence differ. Measure at the function level, not the org level, or you'll average away every meaningful signal.
Ignoring qualitative data. Numbers tell you what's happening. People tell you why. A retention strategy built entirely on attrition rate data will miss the manager who's driving three top performers to quietly interview elsewhere. Stay interviews, skip-level conversations, and exit interview themes aren't "soft data." They're the context that makes your quantitative data interpretable.
Treating lagging indicators as early warnings. By the time attrition spikes, the damage is done. By the time engagement survey scores drop, the disengagement has been compounding for months. Your measurement system needs leading indicators (collaboration pattern changes, declining space bookings, increasing after-hours work) that flag problems while you can still intervene. Trip.com didn't wait for turnover to spike; they measured outcomes in real time and discovered resignations fell by 33% among workers who shifted to hybrid.
Measuring spaces and people in separate systems. This is a costly and common mistake. When your space utilization data lives in facilities, your engagement data lives in HR, and your flex workspace spend lives in finance, nobody has the full picture. A team that sees low office utilization but doesn't know those same employees are booking coworking spaces three days a week through an untracked stipend will draw exactly the wrong conclusions about hybrid adoption.
A single platform that connects people data and space data gives the workplace team, the people team, and the finance team one shared view of reality, and that's where better decisions start.
Gable connects your people, spaces, and workplace data into one platform, with AI insights that turn fragmented signals into clear, actionable strategy.
Request a demo