.svg)


.svg)
- Workplace NPS measures office satisfaction specifically, not overall company sentiment
- A single score tells you something's off; it won't tell you what or why
- Always pair wNPS with one open-ended follow-up question
- Segment results by persona: commuters, managers, new hires all experience the office differently
- Benchmark against your own history, then validate with behavioral data like occupancy and utilization
Workplace NPS applies the classic Net Promoter Score framework to one specific question: how likely are employees to recommend your physical office as a place to work? It's a useful metric, but it's not the whole picture. If you're treating a single number as a workplace strategy, you're making decisions with one eye closed.
What workplace NPS is and how it differs from employee NPS
Most people in HR and workplace ops are familiar with eNPS, the employee Net Promoter Score. It measures whether someone would recommend your company as an employer. Workplace NPS is narrower. It asks whether someone would recommend your office, your physical space, as a good place to get work done.
That distinction matters. Someone can love their company and hate the office. They can be a promoter on eNPS and a detractor on wNPS because the meeting rooms are always booked, the commute is brutal, or the floor plan doesn't support focus work. Separating these signals lets you act on the right problem.
The math is the same as traditional NPS. Ask employees to rate their office experience on a 0 to 10 scale. Group them into promoters (9 to 10), passives (7 to 8), and detractors (0 to 6). Subtract the percentage of detractors from the percentage of promoters. That's your wNPS. A score of 0 means you're breaking even. Scores from 10 to 30 suggest positive but improvable sentiment. Above 50 is exceptional, and rare.
Simple to calculate. Simple to track over time. That simplicity is both the strength and the trap.
The core problem with workplace NPS as a standalone metric
NPS was born in 2003 when Fred Reichheld published "The One Number You Need to Grow" in Harvard Business Review. The original insight was powerful: a single loyalty question could predict customer behavior better than long satisfaction surveys. Companies loved it because it was fast, clean, and easy to benchmark.
But the workplace isn't a product review. When you ask someone to rate their office on a 0 to 10 scale, you're collapsing dozens of variables into one number. Commute time, desk availability, noise levels, collaboration opportunities, food options, air quality, the vibe of the people around them. A score of 6 could mean any of those things. Or all of them.
Here's the deeper issue: wNPS ignores passives. Employees scoring 7 or 8 are treated as neutral, but their feedback often highlights the most actionable improvement areas. These are people who are almost satisfied. They're the closest to tipping into promoter territory, and they're the ones most likely to tell you exactly what's missing.
A wNPS of 28 tells you the office is generally liked. It doesn't tell you that your collaboration spaces sit empty while people fight over phone booths. It doesn't tell you that new hires rate the space 20 points lower than tenured employees because nobody showed them how to book a room. The number is a tripwire. It tells you something is happening. It doesn't diagnose what.
If you want to understand what's actually driving workplace experience, you need more than a score.
The five-pillar framework for workplace NPS that actually works
I've seen too many workplace teams launch a wNPS survey, get a number, put it in a slide deck, and move on. That's not measurement. That's theater. Here's a framework that turns wNPS from a vanity metric into something you can act on.
Pillar 1: Pair wNPS with one open-ended follow-up
Bain's own research on employee NPS found that a second question is the best predictor of energy, enthusiasm, and creativity. For workplace NPS, that question should be: "What one thing would most improve your office experience?"
One question. Not ten. Not a matrix. One open text field that takes 30 seconds to answer. The verbatim responses are where the real insight lives. You'll see patterns fast: "too noisy," "can never find a room," "the commute isn't worth it for what I get here." Those patterns are your roadmap.
Pillar 2: Segment by persona
A company-wide wNPS is a blunt instrument. The office experience for a software engineer who commutes 45 minutes is fundamentally different from the experience of an office manager who lives ten minutes away. New hires experience the space differently than five-year veterans. Individual contributors have different needs than managers who spend half their day in meetings.
Segment your results by at least three dimensions: proximity (commuter vs. local), role type (IC vs. manager), and tenure (under one year vs. over one year). You'll almost always find that your aggregate score masks significant variation. A wNPS of 30 might be hiding a cohort of new hires at negative 5.
This is especially critical if you're thinking about how to improve workplace experience for specific groups rather than making broad, expensive changes that help no one in particular.
Pillar 3: Benchmark internally, not externally
The overall eNPS benchmark hit 27 in recent quarters. That's a useful reference point, but it's a dangerous target. Your wNPS isn't comparable to another company's because your office, your workforce distribution, and your culture are different.
What matters is your trend. Did your wNPS go from 18 to 26 after you redesigned the fourth floor? Did it drop from 32 to 21 after you cut the coffee budget and reduced cleaning frequency? Internal movement over time tells you whether your investments are working. External benchmarks tell you almost nothing actionable.
If you want context for how your office stacks up, pair your wNPS trend with workplace experience benchmarks that account for company size, industry, and work model.
Pillar 4: Triangulate with behavioral data
This is where most wNPS programs fall apart. Surveys measure perception. Behavior measures reality. The two don't always agree.
Consider this scenario: your wNPS is 35. People say they love the office. But your occupancy rate is 38%, meeting room no-show rates are running at 30%, and desk utilization peaks on Tuesdays and craters on Fridays. What's actually happening? People like the idea of the office more than they like being in it. Or they like it on specific days for specific reasons, and the rest of the week it's a ghost town.
You need both signals. Survey data tells you how people feel. Behavioral data, things like office occupancy rates, booking patterns, and space utilization metrics, tells you what they actually do. When the two diverge, that's where the interesting questions live.
Gable's Insights dashboard is built for exactly this kind of triangulation, combining survey sentiment with real occupancy, booking, and utilization data so you can see where perception and behavior align and where they don't.
Pillar 5: Run pulse surveys quarterly, not annually
Annual surveys are autopsies. By the time you get the results, analyze them, and plan a response, the problems have either resolved themselves or metastasized. Quarterly wNPS pulses give you a feedback loop that's fast enough to be useful.
Keep it light: the NPS question, one open-ended follow-up, and maybe one rotating question about a specific topic (collaboration spaces this quarter, commute experience next quarter). Total time to complete: under two minutes. Response rates stay high when surveys are short and when employees see that their feedback actually changes something.

Workplace NPS is one input into a broader employee experience program. Here's how to connect the dots between surveys, space design, and retention.
Read the guide
How to calculate and interpret your workplace NPS score
The calculation is straightforward, but interpretation requires nuance.
Step 1: Ask employees: "On a scale of 0 to 10, how likely are you to recommend this office as a great place to work?"
Step 2: Categorize responses.
- Promoters: 9 to 10
- Passives: 7 to 8
- Detractors: 0 to 6
Step 3: Calculate. wNPS = (% Promoters) minus (% Detractors).
Example: 200 responses. 80 promoters (40%), 70 passives (35%), 50 detractors (25%). wNPS = 40 minus 25 = 15.
A 15 isn't bad. It means you have more fans than critics. But those 70 passives? They're your biggest opportunity. They're close to loving the office. Find out what's holding them back, and your score moves fast.
Score interpretation for workplace-specific NPS:
- Below 0: More detractors than promoters. Something is actively broken.
- 0 to 10: Neutral territory. The office isn't hurting, but it's not helping either.
- 10 to 30: Positive. Most people are satisfied, with clear room to improve.
- 30 to 50: Strong. Your office is a genuine asset for the company.
- 50+: Exceptional. Rare, and usually the result of deliberate, sustained investment.
Remember: these bands are guidelines, not gospel. A 15 that's trending up from negative 3 is a much better story than a 40 that's been sliding for three quarters.
Using behavioral data to validate workplace NPS results
Here's a real pattern I've seen play out. A company surveys its 500-person workforce. wNPS comes back at 28. Leadership celebrates. Then someone pulls the space utilization data and finds that average daily occupancy is 41%, meeting rooms are booked at 85% capacity but actually used only 55% of the time, and the collaboration zones that cost $200K to build are empty most afternoons.
What happened? The people who come to the office like it. But a lot of people aren't coming. And the ones who do come aren't using the spaces the company invested in most heavily.
This is why behavioral data isn't optional. It's the reality check.
Three behavioral signals to pair with wNPS:
Occupancy vs. capacity. If your wNPS is high but occupancy is low, you've built a nice office that people don't need to visit. That's a real estate problem, not a satisfaction problem. You might be right-sizing your space based on the wrong assumptions.
Booking vs. actual usage. High booking rates with high no-show rates mean your reservation system is being used as a placeholder, not a commitment. People book "just in case" and don't show up. That's a policy and culture issue.
Space type utilization. Which spaces get used? Which don't? If focus rooms are packed and collaboration areas are empty, your wNPS follow-up questions should probe whether people are coming to the office for heads-down work, not teamwork. That has implications for your entire floor plan strategy.
Stop guessing whether your office investments are working. Gable Insights pairs employee sentiment with occupancy, booking, and utilization data in one dashboard.
Learn more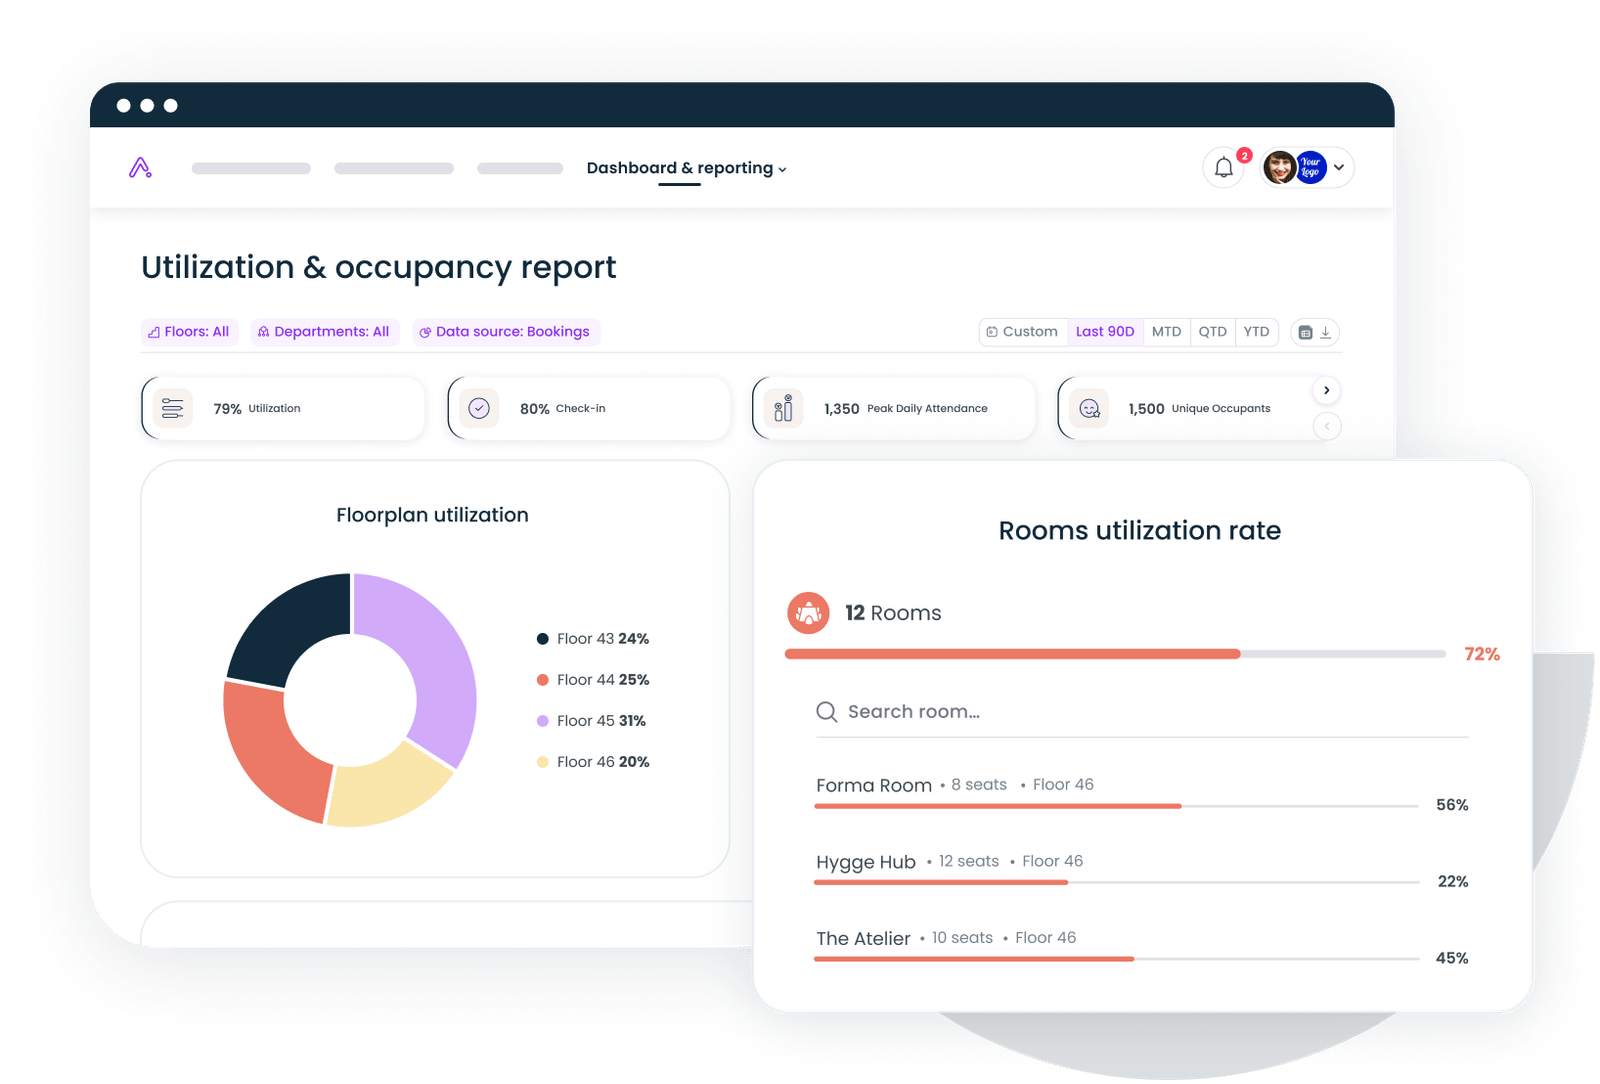
Common mistakes that tank workplace NPS programs
Surveying once a year. Annual surveys are too slow for a workplace that changes quarterly. People forget what bothered them six months ago. You lose the signal.
No follow-up question. A score without context is a number without a story. Always include "What one thing would you change?"
Comparing to industry benchmarks. Your wNPS of 22 vs. an industry average of 25 tells you nothing about what to fix. Your wNPS of 22 vs. your own score of 30 last quarter tells you something went wrong.
Ignoring passives. The 7s and 8s are your swing voters. They're almost promoters. A small improvement, better booking tools, quieter focus areas, a fixed HVAC system, can tip them over.
Tying results to budget cuts. If employees learn that low scores lead to office closures rather than improvements, they'll game the survey. Trust is the foundation of honest feedback. If you're navigating how to get employee buy-in for office changes, start by showing that feedback leads to action, not punishment.
Surveying without acting. The fastest way to kill response rates is to ask for feedback and do nothing with it. Close the loop. Tell people what you heard and what you're doing about it.
Workplace NPS is a starting point, not a strategy
Bain's research on applying NPS to employees found that only 19% of employees say they're both inspired and satisfied at work. That's a sobering number, and it underscores why a single metric can't carry the weight of your entire workplace strategy.
Workplace NPS is worth measuring. It's fast, it's comparable over time, and it gives you an early warning when something shifts. But it's one input among several. The companies that get the most out of wNPS are the ones that treat it as a trigger for deeper investigation, not as the investigation itself.
Pair it with a follow-up question. Segment it by persona. Track your own trend. And then cross-reference what people say with what they actually do. That's where the real insights live: in the gap between perception and behavior.
The office isn't a product you ship once. It's a service you iterate on continuously. wNPS gives you a pulse. Behavioral data gives you the diagnosis. Together, they give you a workplace strategy that's grounded in evidence, not assumptions.
From survey sentiment to real-time occupancy, Gable gives you the full picture of how your office is actually performing.
Get a demo