.svg)


.svg)
Most organizations measure workplace costs but not workplace returns. This guide introduces a five-pillar framework connecting space utilization, human capital productivity, retention, engagement, and collaboration into a unified ROI model, with specific formulas, benchmarks, and a dashboard template to make your workplace investments defensible to finance.
Five talent-related factors (attraction, development, engagement, retention, and performance) cost the median S&P 500 company roughly $480 million a year in lost productivity. That number from McKinsey tends to get a knowing nod from workplace leaders and then zero follow-up, because proving that your desk booking software or hybrid policy or quarterly offsite contributed to closing that gap feels impossible.
The gap is real, but so is the path to closing it. The core challenge with workplace ROI is that the data lives in six different systems owned by four different teams, and nobody has stitched it together into a story a CFO would recognize as a business case. Facilities tracks square footage costs. HR tracks engagement surveys. Finance tracks headcount-to-revenue ratios. Operations tracks badge swipes. Each team measures what's easy for them, which means nobody measures what matters across them.
This guide is built for the workplace leader who's tired of defending a budget with occupancy percentages that don't connect to anything the board cares about. We'll walk through five pillars of workplace ROI, from human capital productivity down to collaboration performance, with specific formulas, benchmarks from 2025-2026 research, and a framework for building a dashboard that ties space investments to business outcomes.
Connected data makes the argument for you. Here's how to build it.
The five pillars of workplace ROI metrics
Before diving into individual metrics, here's the framework. Workplace ROI is a system with five interconnected pillars, not a single number:
| Pillar | What It Measures | Who Owns It |
|---|---|---|
| Human Capital Productivity | Revenue and output per employee | Finance + HR |
| Retention & Attrition | Turnover costs avoided through workplace investments | HR + People Ops |
| Space Utilization & Cost Efficiency | Real estate spend vs. actual usage | Facilities + Real Estate |
| Engagement & Employee Experience | Satisfaction, wellbeing, and cultural health | HR + Workplace |
| Collaboration & Team Performance | Quality and frequency of meaningful teamwork | Workplace + Department Leads |
Most organizations measure one or two of these pillars well and ignore the rest. Measuring all five and showing the connections between them is what separates defensible workplace budgets from hopeful ones. Improving space utilization (Pillar 3) drives collaboration (Pillar 5), which lifts engagement (Pillar 4), which reduces turnover (Pillar 2), which protects revenue per employee (Pillar 1).
That chain reaction is your ROI story.
Human capital ROI: revenue per employee and productivity metrics
A 2,000-person SaaS company generating $400 million in annual revenue produces $200,000 per employee. If a workplace investment (flexible space access, better coordination tools, improved onboarding environments) lifts that number by even 2%, the organization gains $8 million in productivity value. That's the Human Capital Return on Investment (HCROI) formula at work.
The formula:
> HCROI = (Revenue − Operating Expenses − Compensation) ÷ Compensation
An HCROI above 1.0 means every dollar spent on people generates more than a dollar in return. Track it quarterly, and you start seeing how workplace changes (a shift to activity-based working, better meeting room availability, more intentional on-site days) correlate with productivity movements.
Revenue per employee is the blunter version. Easier to calculate, harder to game. For a 500-person company, pull total revenue, divide by headcount, and benchmark against your industry vertical. Tech companies averaged $350,000–$500,000 per employee in 2025. Professional services hovered around $180,000–$250,000.
But raw revenue-per-employee doesn't tell you why productivity changes. That's where you need a second layer of measurement.
Measuring workplace productivity effectively means combining output metrics (deals closed, tickets resolved, features shipped) with input metrics (hours at desk, meeting load, focus time available). Neither alone is useful. Together, they show whether your workplace is enabling deep work or drowning people in conference room Tetris.
Structured onboarding has been shown to drive measurable lifts in new-hire productivity and revenue contribution. Consider the difference when new hires walk into an office where they can find a desk, locate their team, and book a room for their first 1:1, versus showing up to a half-empty floor with no wayfinding and a sticky note that says "sit anywhere."
Key metrics to track:
- Revenue per employee (quarterly trend)
- HCROI ratio
- Output per employee by department
- Focus time vs. meeting time ratio
- New hire time-to-productivity (days to first meaningful contribution)

Leaders who connect space, people, and performance data into a single view stop defending budgets and start driving strategy. See how workplace analytics ties it all together.
Read the complete workplace analytics guide
Retention ROI: calculate the true cost of turnover
Replacing an employee costs 6 to 9 months of their salary, according to SHRM benchmarking data. For a senior engineer earning $180,000, that's $90,000 to $135,000 in recruiting, onboarding, lost productivity, and team disruption per departure. A company with 1,000 employees and 15% annual turnover is burning through $13.5 million to $20 million a year to stay at the same headcount.
Those numbers make workplace investments look cheap by comparison.
The retention ROI formula is straightforward:
> Retention ROI = (Turnover Cost Avoided − Workplace Investment Cost) ÷ Workplace Investment Cost × 100
Say you spend $500,000 annually on flexible workspace access and improved office experience. If those investments reduce turnover by 3 percentage points (from 15% to 12%) at a company with 1,000 employees averaging $120,000 in salary, you've avoided roughly 30 departures. At $80,000 per departure (using the conservative end), that's $2.4 million in costs avoided. Your ROI: 380%.
This isn't theoretical. A majority of employers have reported retention improvements after adopting hybrid policies with proper coordination tools. The key phrase is "proper coordination." Allowing remote work without investing in the systems that make office time purposeful doesn't move the needle. People don't leave because they can't work from home. They leave because showing up to the office feels pointless.
Building a strong employee retention strategy means connecting workplace investments to the reasons people actually stay: career growth, team connection, manager quality, and flexibility. Exit interview data tells you which of these failed. Stay interview data tells you which of these are working. Both feed your retention ROI calculation.
Key metrics to track:
- Annual turnover rate (voluntary vs. involuntary)
- Average cost per departure (by role level)
- Regrettable attrition rate (high performers lost)
- Tenure distribution shift (are people staying longer after workplace changes?)
- Exit interview themes related to workplace experience
Space and real estate ROI: utilization, cost efficiency, and occupancy intelligence
Global office utilization reached 54% in 2025, up from 49% in 2024. That means 46% of the office space companies pay for sits empty on any given day. For a company leasing 50,000 square feet at $65 per square foot annually, that's $1.5 million a year warming chairs nobody sits in.
You're wasting money on space. The real questions are how much, and what to do about it.
Office occupancy tracking separates the companies optimizing their portfolios from the ones guessing. Real utilization data, pulled from badge swipes, WiFi connections, and booking confirmations, shows patterns that walk-throughs and manager estimates consistently miss. Floor 3 at 12% occupancy every Friday. The east wing conference rooms booked 80% of the time but physically occupied only 35%. Desk neighborhoods assigned to a team of 40 that never has more than 11 people on-site simultaneously.
Each of those patterns represents a decision: consolidate floors, release meeting rooms to hot-desking, rightsize your lease at renewal.
The core space ROI formula:
> Space ROI = (Cost Savings from Optimization − Implementation Cost) ÷ Implementation Cost × 100
Gable customers have seen a 32% reduction in unused desk space after implementing coordinated booking and interactive floor plans. For that 50,000-square-foot office, a 32% reduction in waste translates to roughly $480,000 in annual savings, or the ability to defer a lease expansion by two years.
But cost per square foot alone is a vanity metric. What matters is cost per productive square foot. A 200-person company paying $40 per square foot for 30,000 square feet has a headline cost of $1.2 million. If actual daily occupancy averages 108 people, the effective cost is $11,111 per productive employee per year. Cut that denominator (fewer people showing up) and your cost per productive square foot spikes, even though your total spend stays flat.
Smart office space planning means designing for peak collaboration days (usually Tuesday through Thursday) rather than for the Monday-and-Friday ghost towns. Activity-based layouts, bookable desks, and team neighborhoods let you support 200 people in the space you'd normally need for 130 permanent assignments.
Key metrics to track:
- Daily/weekly occupancy rate (actual vs. capacity)
- Cost per square foot (headline vs. productive)
- Desk utilization rate (booked vs. used)
- Meeting room utilization (booked vs. occupied)
- Lease cost avoidance from portfolio optimization
- Flex space spend as percentage of total real estate cost
Employee experience ROI: engagement, wellbeing, and productivity gains
Gallup's latest global data shows companies in the top quartile of employee engagement achieve 23% higher profitability and 18% higher productivity compared to bottom-quartile organizations. Disengagement costs US firms alone $550 billion annually. That gap between engaged and disengaged isn't a "nice to have" cultural aspiration; it's a measurable financial position.
The challenge is attribution. When engagement scores rise, was it the new office redesign, the updated hybrid policy, the manager training program, or the free lunch on Wednesdays?
Probably some combination. The point of measuring employee experience isn't to isolate a single variable. It's to track the bundle of workplace investments over time and correlate them with business outcomes. Run a quarterly eNPS (Employee Net Promoter Score) alongside your engagement survey, and you start seeing which investments move the needle and which generate Slack applause but no behavioral change.
Wellness programs are one area where ROI data has matured significantly. 82% of CEOs now report positive ROI from wellness investments, with 30% seeing returns above 100%, meaning every dollar invested delivers at least two dollars back through reduced absenteeism, lower healthcare costs, and improved productivity. The catch: wellness programs that exist only as app subscriptions have weaker outcomes than ones embedded into the physical workplace, including on-site fitness options, ergonomic assessments, and quiet zones for mental health breaks.
The workplace itself is the engagement program. 73% of employees report higher productivity under hybrid models, with an average 19% performance gain, but only when the office experience justifies the commute. Nobody gains 19% productivity from a 45-minute commute to sit on a Zoom call they could have taken from home.
A deliberate employee experience strategy connects the physical environment (space quality, amenities, accessibility) with the digital experience (booking ease, wayfinding, event discovery) and the social experience (team coordination, cross-functional collisions, manager presence). Measuring each layer independently shows you where the experience breaks down.
Key metrics to track:
- eNPS (quarterly, segmented by office location and team)
- Engagement survey scores (with workplace-specific questions)
- Absenteeism rate (days lost per employee per quarter)
- Presenteeism indicators (output quality during on-site days vs. remote)
- Wellness program participation and self-reported impact
- Workplace satisfaction scores (post-visit or post-booking feedback)
When your space data, people data, and engagement data live in one platform, you stop guessing which investments matter and start proving it. See how unified workplace intelligence makes that possible.
Explore Gable Insights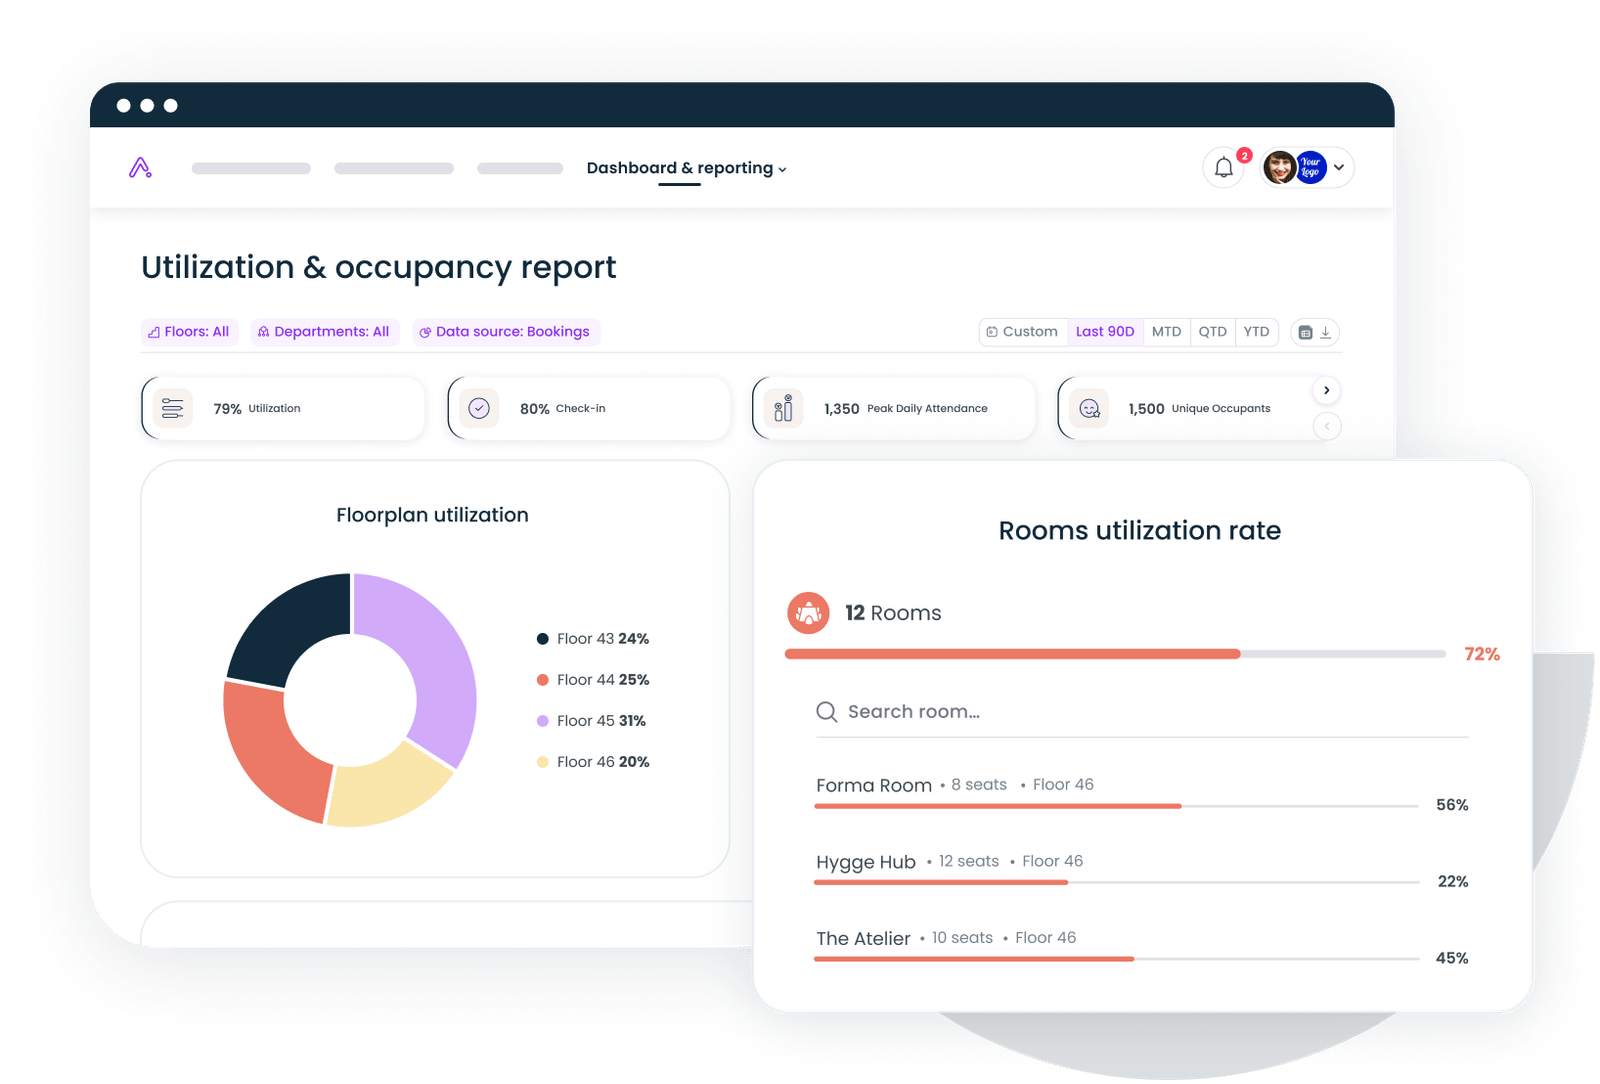
Collaboration and team performance ROI
Seventy-two percent of bookings on coordinated workplace platforms are for team gatherings, not solo work. That statistic tells you something important about why people come to the office: they're showing up for each other, not for a desk and a monitor.
Collaboration ROI is the hardest pillar to measure and the most important one to get right. Organizations with strong cultures consistently outperform competitors in profitability, and culture is built, or eroded, in the quality of team interactions.
Start with what's countable. Meeting effectiveness can be measured by the ratio of meetings that produce a documented decision or action item versus meetings that produce nothing but a follow-up meeting. Cross-functional project velocity (the time from kick-off to delivery on projects requiring multiple teams) reveals whether your workplace model enables or blocks coordination.
Then look at coordination patterns. How often do teams successfully overlap on-site? A 40-person engineering team where 6 people show up Monday, 8 on Tuesday, 12 on Wednesday, 4 on Thursday, and 2 on Friday isn't collaborating; they're colocating in shifts. The connection between engagement and productivity depends on whether on-site time is synchronized, not merely available.
Event attendance tells another piece of the story. Companies using structured event management see a 30%+ increase in attendance when events are promoted through integrated channels (Slack, email, calendar invites, push notifications) rather than buried in a wiki page nobody checks. Team gatherings shouldn't require a project manager and a shared spreadsheet to coordinate.
On-demand workspace access adds another layer. When a product team in Austin needs to run a two-day design sprint, and three of the eight participants are remote employees scattered across Texas, booking a coworking space through a centralized platform turns a logistical nightmare into a 90-second reservation. That saved time is measurable. The design sprint's output is measurable. The retention impact of making distributed employees feel included is harder to quantify, but exit interviews tell the story over time.
Adapting your company's approach to a thoughtful hybrid work model means measuring whether your flexibility investments translate into more meaningful collaboration or more optionality without direction.
Key metrics to track:
- Team overlap rate (% of team on-site on the same days)
- Cross-functional project cycle time
- Meeting-to-decision ratio
- Event attendance rate (invited vs. attended)
- On-demand booking purpose (solo vs. team)
- Post-gathering satisfaction and productivity self-reports
Building your workplace ROI dashboard: key metrics, tools, and frequency
A dashboard nobody checks is worse than no dashboard; it creates the illusion of measurement without the reality of action. The workplace ROI dashboards that drive decisions share three characteristics: they're concise (5–7 core KPIs, not 30), they're connected (pulling from multiple data sources into a single view), and they're cadenced (reviewed monthly with quarterly deep dives).
Here's a starter framework:
| Metric | Source | Frequency | Owner |
|---|---|---|---|
| Revenue per employee | Finance/ERP | Quarterly | Finance |
| Voluntary turnover rate | HRIS | Monthly | HR |
| Office occupancy rate | Badge/WiFi/Booking | Weekly | Facilities |
| Desk utilization rate | Booking platform | Weekly | Workplace |
| eNPS | Pulse survey | Quarterly | HR |
| Team overlap rate | Booking + HRIS data | Monthly | Workplace |
| Cost per productive sq ft | Finance + Occupancy | Quarterly | Real Estate |
The trap most organizations fall into: building separate dashboards for each team. Facilities has a utilization dashboard. HR has an engagement dashboard. Finance has a headcount cost dashboard. Nobody sees the connections.
Unified workplace data means integrating your HRIS (Workday, Rippling), your access control system (badge data), your WiFi analytics, your booking platform, and your survey tools into a single reporting layer. This integration isn't optional; it's the foundation of any credible ROI argument. When you can show that floors with 70%+ team overlap score 15 points higher on eNPS and produce 22% faster project delivery, you've moved from "we think the office matters" to "here's exactly how much."
Steps to build your dashboard:
- Establish baselines. Pull 90 days of historical data across all five pillars before making any changes. You can't prove improvement without a starting point.
- Connect your data sources. Integrate HRIS, access control, booking, and survey platforms into a unified reporting layer. The integration is non-negotiable regardless of the tool you use.
- Set targets. Not aspirational targets, but achievable ones tied to specific workplace investments. "Increase team overlap rate from 34% to 50% within two quarters by implementing coordinated in-office days."
- Review monthly, act quarterly. Monthly reviews catch trends. Quarterly reviews drive strategy changes: lease adjustments, policy updates, space redesigns.
- Report to finance in their language. Nobody on the finance team cares about your desk utilization rate. They care that you converted 8,000 square feet of underused space into $520,000 of annual lease savings.
Common pitfalls in measuring workplace ROI
Pitfall 1: treating utilization as a success metric
An office at 90% occupancy isn't automatically delivering ROI. If people are packed in but miserable (fighting for meeting rooms, unable to find focus space, eating lunch at their desks because the kitchen is a zoo) you've optimized for the wrong thing. Utilization measures presence. ROI measures outcomes.
Pitfall 2: ignoring attribution complexity
Engagement scores rose 8 points after you redesigned the office. Did the redesign cause it, or did the new VP of Engineering who started the same month? You'll never isolate workplace impact perfectly. The solution: measure multiple indicators simultaneously and look for consistent patterns across teams, locations, and time periods. If three offices all show engagement improvements after similar workspace changes, the signal is real.
Pitfall 3: measuring annually
Annual measurement is post-mortem analysis, not management. By the time you discover that Q2's office changes tanked productivity, you've lost two quarters of potential correction. Monthly data review catches problems while they're still fixable.
Pitfall 4: data silos masquerading as measurement
Facilities reports utilization to their VP. HR reports engagement to their CHRO. Finance reports cost-per-head to the CFO. Each team's metrics look fine in isolation. Nobody notices that the building with the lowest cost-per-head also has the highest turnover and lowest engagement, because nobody's looking at all three together.
Pitfall 5: confusing activity with impact
Booking volume is activity. Collaboration quality is impact. Event registrations are activity. Post-event NPS and cross-team project launches are impact. Every metric on your dashboard should answer: "So what?"
From data to decision: using workplace ROI to drive strategy
The CFO doesn't want a dashboard tour. They want three slides: what you spent, what you got, and what you recommend for next year.
Framing workplace ROI for finance requires translating every metric into dollars or risk. "Desk utilization is 43%" means nothing. "We're paying $2.1 million annually for space that's 57% empty, and consolidating to two floors saves $740,000 without affecting collaboration quality" means everything. Same data. Different language.
Build your business case around a before-and-after structure:
- Before: 50,000 sq ft across three floors, 43% average utilization, $3.25M annual lease cost, 16% voluntary turnover, eNPS of 22
- After (12 months with workplace platform + hybrid coordination): Two floors totaling 35,000 sq ft, 67% utilization, $2.28M annual lease cost, 12.5% voluntary turnover, eNPS of 38
- Net impact: $970K lease savings + $1.8M turnover cost avoidance − $180K platform investment = $2.59M annual return
That's the kind of math that gets budgets approved. Not for this year, but for next year and the one after.
Treat your workplace like a product. Ship changes, measure outcomes, iterate. A team that tested coordinated in-office Tuesdays and Thursdays for one quarter, measured team overlap and eNPS, and found a 40% collaboration improvement and 11-point NPS gain has a data-backed argument for scaling that policy company-wide. A team that mandated three days in office because the CEO read an article has an opinion.
The companies getting this right (Stripe, Snowflake, Dropbox, and others) aren't spending more on workplace. They're spending better, because they can see what works, cut what doesn't, and prove the difference.
Gable connects your offices, flex spaces, and events into one platform with unified analytics, so every workplace dollar has a number attached to it. See what that looks like for your organization.
Request a demo